Showing posts with label distributed-computing. Show all posts

2018-12-20

Isolation is not participation


First
  1. I speak only for myself as an individual, not representing any current or previous employer, ASF ...etc.
  2. I'm not going anywhere near business aspects; out of scope.
  3. I am only looking at Apache Hadoop, which is of course the foundation of Amazon EMR. Which also means: if someone says "yes but projects X, Y & Z, ..." my response is "that's nice, but coming back to the project under discussion, ..."
  4. lots of people I know & respect work for Amazon. I am very much looking at the actions of the company, not the individuals.
  5. And I'm not making any suggestions about what people should do, only arguing that the current stance is harmful to everyone.
  6. I saw last week that EMR now has a reimplementation of the S3A committers, without any credit whatsoever for something I consider profound. This means I'm probably a bit sensitive right now. I waited a couple of days before finishing this  post,
With that out the way:-

As I type this a nearby terminal window runs MiniMR jobs against a csv.gz file listing AWS landsat photos, stored somewhere in a bucket.

The tests run on a macbook, a distant descendant of BSD linux, Mach Kernel and its incomplete open source sibling, Darwin. Much of the dev tooling I use is all open source, downloaded via homebrew. The network connection is via a router running DD-WRT.


That Landsat file, s3a://landsat-pds/scene_list.gz, is arguably the single main contribution from the AWS infra for that Hadoop testing.

It's a few hundred MB of free to use data, so I've used it for IO seek/read performance tests, spark dataframe queries, and now, SQL statements direct to the storage infrastructure. Those test are also where I get to explore the new features of the java language, LambdaTestUtils, which is my lifting of what I consider to be the best bits of scalatest. Now I'm adding async IO operations to the Hadoop FileSystem/FileContext classes, and in the tests I'm learning about the java 8+ completable future stuff, how to get them to run IOException-raising code (TL;DR: it hurts)

While I wait for my tests to finish, I see, there's a lot of online discussion about could providers and open source projects, especially post AWS re:Invent (re:Package?), so I'd thought I'd join in.


Of all the bits of recent writing on the topic, one I really like is Roman's, which focuses a lot on community over code.

That is a key thing: open source development is a community. And members of that community can participate by
  1. writing code
  2. reviewing code
  3. writing docs
  4. reviewing docs
  5. testing releases, nightly builds
  6. helping other people with their problems
  7. helping other projects who are having problems with your project's code.
  8. helping other projects take ideas from your code and make use of it
  9. filing bug reports
  10. reviewing, commenting, on, maybe even fixing bug reports.
  11. turning up a conferences, talking about what you are doing, sharing
  12. listening. Not just to people who pay you money, but people who want to use the stuff you've written.
  13. helping build that community by encouraging the participation of others, nurturing their contributions along, trying to get them to embrace your code and testing philosophy, etc.
There are more, but those are some of the key ones.

A key, recurrent theme is that community, where you can contribute in many ways, but you do have to be proactive to build that community. And the best ASF projects are ones which have a broad set of contributors

Take for example, the grand Java 9, 10, 11 project: [HADOOP-11123, HADOOP-11423, HADOOP-15338 ]. That's an epic of suffering, primarily taken on by Akira Ajisaka, and Takanobu Asanuma at Yahoo! Japan, and a few other brave people. This isn't some grand "shout about this at keynotes" kind of feature, but its a critical contribution by people who rely on Hadoop and have a pressing need "Run on Java 9+", and are prepared to put in the effort. I watch their JIRAs with awe.

That's a community effort, driven by users with needs.

Another interesting bit of work: Multipart Upload from HDFS to other block stores. I've  been the specification police there; my reaction to "adding fundamental APIs without strict specification and tests" was predictable, so I don't know why they tried to get it past me. Who did that work? Ewan Higgs at Western Digital did a lot -they can see real benefit for their enterprise object store. Virajith Jalaparti at Microsoft, People who want HDFS to be able to use their storage systems for the block store. And there's another side-effect: that mulitpart upload API essentially provides a standard API for multipart-upload based committers. For the S3A committers we added our own private API to S3A FS "WriteOperationHelper"; this will give it to every FS which supports it. And you can do a version of DistCP which writes blocks to the store in parallel from across the filesystem...a very high performance blockstore-to-block-or-object store copy mechanism.

This work is all being done by people who sell storage in one form or another, who see value in the feature, and are putting in the effort to develop it in the open, encourage participation from others, and deliver  something independent of underlying storage

This bit of work highlights something else: that Hadoop FS API is broadly used way beyond HDFS, and we need to evolve it to deal with things HDFS offers but keeps hidden, but also for object stores, whose characteristics involve:
  • very expensive cost of seek(), especially given ORC and Parquet know their read plan way beyond the next read. Fix: HADOOP-11867: Vectorized Read Operations,
  • very expensive cost of mimicking hierarchical directory trees, treewalking is not ideal,
  • slow to open a file, as even the existence check can take hundreds of milliseconds.
  • Interesting new failure modes. Throttling/503 responses if you put too much load on a shard of the store, for example. Which can surface anywhere.
  • Variable rename performance O(data) for mimicked S3 rename, O(files) for GCS, O(1) with some occasional pauses on Azure.
There are big challenges here and it goes all the way through the system. There's no point adding a feature in a store if the APIs used to access it don't pick it up; there's no point changing an API if the applications people use don't adopt it.

Which is why input from the people who spent time building object stores and hooking their application is so important. That includes:
  • Code
  • Bug reports
  • Insight from their experiences
  • Information about the problems they've had
  • Problems their users are having
And that's also why the decision of of the EMR team to isolate themselves from the OSS development holds us back.

We end up duplicating effort, like S3Guard, which is the ASF equivalent of EMR consistent view. The fact that EMR shipped with a feature long before us, could be viewed as their benefit of having a proprietary S3 connector. But S3Guard, like the EMR team, models its work on Netflix S3mper. That's code which one of the EMR team's largest customers wrote, code which Netflix had to retrofit onto the EMR closed-source filesystem using AspectJ.

And that time-to-market edge? Well, is not so obvious any more
  1. The EMR S3-optimised committer shipped in November 2018.
  2. Its open source predecessor, the S3A committers, shipped in Hadoop 3.1, March 2018. That's over 7-8 months ahead of the EMR implementation.
  3. And it shipped in HDP-3.0 in June 2018. That's 5 months ahead.
I'm really happy with that committer, first bit of CS-hard code I've done for a long time, got me into the depths of how committers really work, got an unpublished paper  "A zero Rename Committer" from it. And, in writing the TLA+ spec of the object store I used on the way to convincing myself things worked, I was corrected by Lamport himself.

Much of that commit code was written by myself, but it depended utterly on some insights from Thomas Demoor of WDC, It also contains a large donation of code from Netflix, their S3 committer. They'd bypassed emrfs completely and were using the S3A client direct: we took this, hooked it up to what we'd already started to write, incorporated their mockito tests —and now their code is the specific committer I recommend. Because Netflix were using it and it worked.

A heavy user of AWS S3 wanting to fix their problem, sharing the code, having it pulled into the core code so that anyone using the OSS releases gets the benefit of their code *and their testing*.

We were able to pick that code up because Netflix had gone around emrfs and were writing things themselves. That is: they had to bypass the EMR team. And once they'd one that, we could take it, integrate it and ship it eight months before that EMR team did. With proofs of correctness(-ish).

Which is why I don't believe that isolationism is good for whoever opts out of the community. Nor, by the evidence, is is good for their customers.

I don't even think it helps the EMR team's colleagues with their own support calls. Because really, if you aren't active in the project, those colleagues end up depending on the goodwill of others.


(photo: building in central Havana. There'll be a starbucks there eventually)

2017-11-23

How to play with the new S3A committers

Untitled

Following up from yesterday's post on the S3A committers, here's what you need for picking up the committers.
  1. Apache Hadoop trunk; builds to 3.1.0-SNAPSHOT:  
  2. The documentation on use.
  3. An AWS keypair, try not to commit them to git. Tip for the Uber team: git-secrets is something you can add as a checkin hook. Do as I do: keep them elsewhere.
  4. If you want to use the magic committer; turn S3Guard on. Initially I'd use the staging committer, specificially the "directory" on.
  5. switch s3a:// to use that committer: fs.s3a.committer.name =  partitioned
  6. Run your MR queries
  7. look in _SUCCESS for committer info. 0-bytes long: classic FileOutputCommitter. Bit of JSON naming committer, files committed and some metrics (SuccessData) and you are using an S3 committer.
If you do that: I'd like to see the numbers comparing FileOutputCommitter (which must have S3Guard) and the new committers. For benchmark consistency, leave S3Guard on.

If you can't get things to work because the docs are wrong: file a JIRA with a patch. If the code is wrong: submit a patch with the fix & tests.

Spark?
  1. Spark Master has a couple of patches to deal with integration issues (FNFE on magic output paths, Parquet being over-fussy about committers, I think the committer binding has enough workarounds for these to work with Spark 2.2 though.
  2. Checkout my cloud-integration for Apache Spark repo, and its production-time redistributable, spark-cloud-integration.
  3. Read its docs and use
  4. If you want to use Parquet over other formats, use this committer.  
  5. Again,. check _SUCCESS to see what's going on.
  6. There's a test module with various (scaleable) tests as well as a copy and paste of some of the Spark SQL test.
  7. Spark can work with the Partitioned committer. This is a staging committer which only worries about file conflicts in the final partitions. This lets you do in-situ updates of existing datasets, adding new partitions or overwriting existing ones, while leaving the rest alone. Hence: no need to move the output of a job into the reference datasets.
  8. Problems. File an issue. I've just seen Ewan has a couple of PRs I'd better look at, actually.
Committer-wise, that spark-cloud-integration module is ultimately transient. I think we can identify those remaining issues with committer setup in spark core, after which a hadoop 3.0+ specific module should be able to work out the box with the new committers.

There's still other things there, like
  • Cloud store optimised file input stream source
  • ParallizedWithLocalityRDD: and RDD which lets you provide custom functions to declare locality on a row-by-row basis. Used in my demo of implementing DistCp in Spark. Every row is a filename, which gets pushed out to a worker close to the data, it does the upload. This is very much a subset of distCP, but it shows this: you can have with with RDDs and cloud storage.
  • + all the tests
I think maybe Apache Bahir would be the ultimate home for this. For now, a bit too unstable.

(photo: spices on sale in a Mombasa market)

2017-09-09

Stocator: A High Performance Object Store Connector for Spark


Behind Picton Street

IBM have published a lovely paper on their Stocator 0-rename committer for Spark

Stocator is:
  1. An extended Swift client
  2. magic in their FS to redirect mkdir and file PUT/HEAD/GET calls under the normal MRv1 __temporary paths to new paths in the dest dir
  3. generating dest/part-0000 filenames using the attempt & task attempt ID to guarantee uniqueness and to ease cleanup: restarted jobs can delete the old attempts
  4. Commit performance comes from eliminating the COPY, which is O(data),
  5. And from tuning back the number of HTTP requests (probes for directories, mkdir 0 byte entries, deleting them)
  6. Failure recovery comes from explicit names of output files. (note, avoiding any saving of shuffle files, which this wouldn't work with...spark can do that in memory)
  7. They add summary data in the _SUCCESS file to list the files written & so work out what happened (though they don't actually use this data, instead relying on their swift service offering list consistency). (I've been doing something similar, primarily for testing & collection of statistics).

Page 10 has their benchmarks, all; of which are against an IBM storage system, not real amazon S3 with its different latencies and performance.

Table 5: Average run time


Read-Only 50GB
Read-Only 500GB
Teragen
Copy
Wordcount
Terasort
TPC-DS
Hadoop-Swift Base
37.80±0.48
393.10±0.92
624.60±4.00
622.10±13.52
244.10±17.72
681.90±6.10
101.50±1.50
S3a Base
33.30±0.42
254.80±4.00
699.50±8.40
705.10±8.50
193.50±1.80
746.00±7.20
104.50±2.20
Stocator
34.60±0.56
254.10±5.12
38.80±1.40
68.20±0.80
106.60±1.40
84.20±2.04
111.40±1.68
Hadoop-Swift Cv2
37.10±0.54
395.00±0.80
171.30±6.36
175.20±6.40
166.90±2.06
222.70±7.30
102.30±1.16
S3a Cv2
35.30±0.70
255.10±5.52
169.70±4.64
185.40±7.00
111.90±2.08
221.90±6.66
104.00±2.20
S3a Cv2 + FU
35.20±0.48
254.20±5.04
56.80±1.04
86.50±1.00
112.00±2.40
105.20±3.28
103.10±2.14

The S3a is the 2.7.x version, which has the stabilisation enough to be usable with Thomas Demoor's fast output stream (HADOOP-11183). That stream buffers in RAM & initiates the multipart upload once the block size threshold is reached. Provided you can upload data faster than you run out of RAM, it avoids the log waits at the end of close() calls, so has significant speedup. (The fast output stream has evolved into the S3ABlockOutput Stream (HADOOP-13560) which can buffer off heap and to HDD, and which will become the sole output stream once the great cruft cull of HADOOP-14738 goes in)

That means in the doc, "FU" == fast upload, == incremental upload & RAM storage. The default for S3A will become HDD storage, as unless you have a very fast pipe to a compatible S3 store, it's easy to overload the memory

Cv2 means MRv2 committer, the one which does  single rename operation on task commit (here the COPY), rather than one in task commit to promote that attempt, and then another in job commit to finalise the entire job. So only: one copy of every byte PUT, rather than 2, and the COPY calls can run in parallel, often off the critical path

 Table 6: Workload speedups when using Stocator


Read-Only 50GB
Read-Only 500GB
Teragen
Copy
Wordcount
Terasort
TPC-DS
Hadoop-Swift Base
x1.09
x1.55
x16.09
x9.12
x2.29
x8.10
x0.91
S3a Base
x0.96
x1.00
x18.03
x10.33
x1.82
x8.86
x0.94
Stocator
x1
x1
x1
x1
x1
x1
x1
Hadoop-Swift Cv2
x1.07
x1.55
x4.41
x2.57
x1.57
x2.64
x0.92
S3a Cv2
x1.02
x1.00
x4.37
x2.72
x1.05
x2.64
x0.93
S3a Cv2 + FU
x1.02
x1.00
x1.46
x1.27
x1.05
x1.25
x0.93


Their TCP-DS benchmarks show that stocator & swift is slower than TCP-DS Hadoop 2.7 S3a + Fast upload & MRv2 commit. Which means that (a) the Hadoop swift connector is pretty underperforming and (b) with fadvise=random and columnar data (ORC, Parquet) that speedup alone will give better numbers than swift & stocator. (Also shows how much the TCP-DS Benchmarks are IO heavy rather than output heavy the way the tera-x benchmarks are).

As the co-author of that original swift connector then, what the IBM paper is saying is "our zero rename commit just about compensates for the functional but utterly underperformant code Steve wrote in 2013 and gives us equivalent numbers to 2016 FS connectors by Steve and others, before they started the serious work on S3A speedup". Oh, and we used some of Steve's code to test it, removing the ASF headers.

Note that as the IBM endpoint is neither the classic python Openstack swift or Amazon's real S3, it won't exhibit the real issues those two have. Swift has the worst update inconsistency I've ever seen (i.e repeatable whenever I overwrote a large file with a smaller one), and aggressive throttling even of the DELETE calls in test teardown. AWS S3 has its own issues, not just in list inconsistency, but serious latency of HEAD/GET requests, as they always go through the S3 load balancers. That is, I would hope that IBM's storage offers significantly better numbers than you get over long-haul S3 connections. Although it'd be hard (impossible) to do a consistent test there, I 'd fear in-EC2 performance numbers to be actually worse than that measures.

I might post something faulting the paper, but maybe I'll should to do a benchmark of my new committer first. For now though, my critique of both the swift:// and s3a:// clients is as follows

Unless the storage services guarantees consistency of listing along with other operations, you can't use any of the MR commit algorithms to reliably commit work. So performance is moot. Here IBM do have a consistent store, so you can start to look at performance rather than just functionality. And as they note, committers which work with object store semantics are the way to do this: for operations like this you need the atomic operations of the store, not mocked operations in the client.

People who complain about the performance of using swift or s3a as a destination are blisfully unaware of the key issue: the risk of data loss due inconsistencies. Stocator solves both issues at once.

Anyway, means we should be planning a paper or two on our work too, maybe even start by doing something about random IO and object storage, as in "what can you do for and in columnar storage formats to make them work better in a world where a seek()+ read is potentially a new HTTP request."

(picture: parakeet behind Picton Street)


2016-02-27

Voxxdev Bristol 2016: theory meets practitioners

I've been hanging out with other bits of the Bristol tech/dev world recently, rather than the usual big data suspects.

Two weeks ago, I actually infiltrated the local Test meetup, which was entertaining, not just for the Bath Gem Ale which JustEat has on tap in their meeting area, but because I sit there, beer in hand, while speakers covered Applied Exploratory Testing, what its like turning up as a QA team to a new company and the patterns-of-untestability that you encounter (and how to start to get things under control).

This week, I took a break from worrying about the semantics of flush() and its impact of durability of timeline 1.5 event histories. (i.e. why my incomplete apps aren't showing up in an ATS-backed  Spark History server if file:// is the intermediate FS of the test run). Wandered down to the Watershed Cinema with Tom White and a light hangover related to Tom White's overnight stay including an evening visit the Bravas Tapas Bar —and into a one-day dev conference, Voxxdev Bristol 2016.

It was a good day. Oracle have been putting a lot of effort into the conf as a way raising visibility of what's going on in tech in the area to make more people aware the west of england a more interesting place to be than London, and with other companies and one of the local universities had put together a day-long conference.

I was one of the speakers; I'd put in my Household Infosec talk, but the organisers wanted something more code-related, and opted for Hadoop and Kerberos, the Madness Beyond The Gate. I don't think that was the right talk for the audience. It's really for people writing code to run inside a Hadoop cluster, and to explain to the QE and support people that the reason they suffer so much is those developers aren't testing on secure clusters. (that's the version I gave at Cloudera Palo Alto last month). When you are part way into a talk and you realise that you can't assume the audience knows how HDFS works then you shouldn't really be talking to them about retrieving block-tokens from the NN from a YARN app handed off a delegation token in the launch context by a client authed against the KDC. Normally I like a large fraction of the audience to come out of a talk feeling they'd benefited; this time I'm not sure.

I felt a bit let down the oracle big data talk, though impressed that people are still writing Swing apps. I was even more disappointed by the IoT talk, where he not only accused Hadoop of being insecure (speaker missed my talk, then), most of his slides seemed lifted from elsewhere: one a cisco IoT arch, one dell hadoop cluster design. Julio pointed out later that the brontobyte slide was one HP Labs have been using. Tip: if you use other's slides, either credit them or make sure the authors aren't attendees.

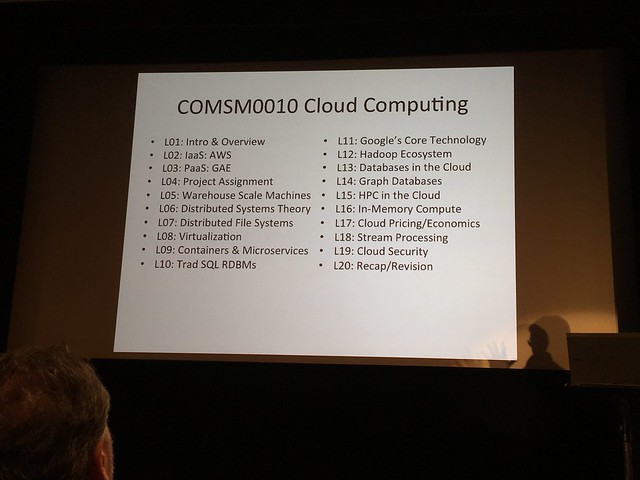
I really liked some of the other talks. There was a great keynote by a former colleague, Dave Cliff, now at Bristol Uni, talking about what they are up to. This is the lecture series on their cloud computing course. 

Cloud Computing Curriculum

That's a big change given that in 2010, all they had was a talk Julio and I gave in the HPC course

I might volunteer to give one of the new course's talks in exchange for being able to sit in on the other lectures (and exemption from exams, tutorials and homework, obviously)

My favourite talk turned out to be Out of the Fire Swamp, by Adrian Colyer.

Adrian writes "The morning paper" blog, which is something I'm aware of, in awe of and in fear of. Why fear? There's too many papers to read; I can't get through 1/day and to track the blog would only make it clear how behind I was. I already have a directory tree full of papers I think I need to understand. Of course, if you do read a related paper/day, it probably gets easier, except I'm still trying to complete [Ulrich99], as my and relate it to modern problems.

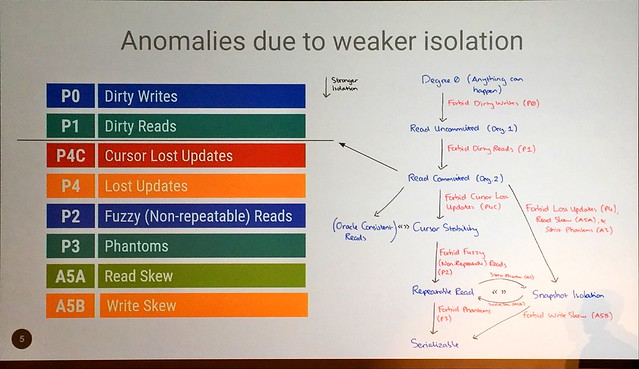
Adrian introduced the audience to data serialization, causality and happens-before, then into linearalizability [HW90]

Read Committed


This was a really good talk.

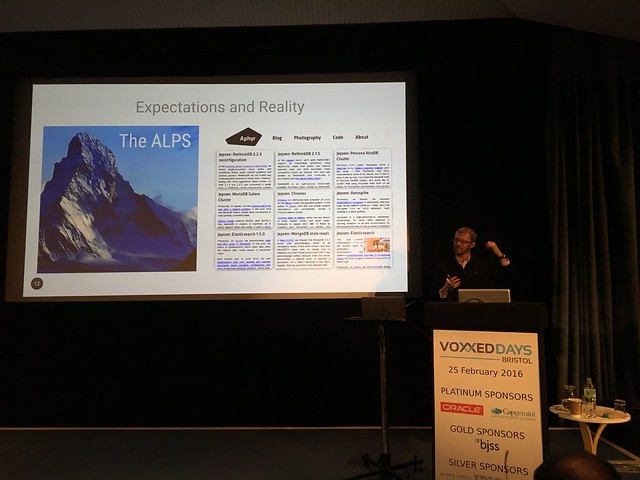
Expectations and Reality

All the code we write is full of assumptions. We assume that n + 1 > n, though we know in our head that if n = 2^31 and its stored in a signed int32, that doesn't hold. (more formally, in two's complement binary arithmetic, for all registers of width w, n+1 > n only holds for all n where n < 2^(w-1).

Sometimes even that fundational n+1 > n assumption catches us out. We assume that two assignments in source code happen in order, though in fact not only does the JVM reserve the right to re-order things, even, in the past, wrongly —and anyway, the CPU can reorder stuff as well.

What people aren't aware of in modern datacentre-scale computing is what assumptions the systems underneath have made in order to give their performance/consistency/availability/liveness/persistence features or whatever it is they offer. To put differently: we think we know what the systems we depend on do, but every so often we find out our assumptions were utterly wrong. What Adrian covered is the foundational CS-complete assumptions, that you had really be asking hard questions about when you review technologies.

He also closed with a section on future system trends, especially storage, with things like  non-volatile DIMMS (some capacitor + SSD to do a snapshot backup on power loss), faster SSD and those persistent technologies with performance between DRAM and SSD: looking at a future where tomorrow's options about durability vs. retrieval time are going to be (at least from some price points), significantly different from today's. Which means that we'd better stop hard coding those assumptions into our systems.


Overall, a nice event, especially given it in the second closest place to my house where you could hold a conference (Bristol University would have been 7 minutes rather than 15 minutes walk). I had the pleasure of meeting some new people in the area working on stuff, including the illustrious James Strachan who'd come up from Somerset for the day.

I liked the blend of some CS "Lamport Layer" work with practical stuff; gives you both education and things you can make immediate use of. I know Martin Kleppman has been going round evangelising classic distributed computing problems to a broader audience, and Berlin Buzzwords 2016 has a talk Towards consensus on distributed consensus  it's clearly something the conferences need.

If there was a fault, as well as some of the talks not being ideal for the audience (mine), I'd say it's got the usual lack of diversity of a tech conference. You could say "well. that's the industry", but it doesn't have to be, and even if that is the case it doesn't have to be so unbalanced in the speakers. In the BBuzz even not only are there two women keynoting, we submission reviewers were renewing the talks anonymously: we didn't know who was submitting, instead going on the text alone.

For the next Bristol conference, I'd advocate going closer in Uni/industry collaboration by offering some of the students tickets. Maybe even some of the maths & physics students rather than just CS. I also think maybe there should be a full strand dedicated to CS theory. Seriously: we can do causality, formality, set theory & relational algebra, paxos+ZK+REEF, reliability theory, graphs etc. Things that apply to the systems we use, but stuff people kind of ignore. I like this idea ... I can even think of a couple of speakers. Me? I'd sit in the audience trying to keep up.

[HW90] Herlihy and Wing, Linearizability: A Correctness Condition for Concurrent Objects, 1990.

[Ulrich99] Ulrich, A.W., Zimmerer, P. and Chrobok-Diening, Test architectures for testing distributed system, 1999. Proceedings of the 12th International Software Quality Week.

2015-09-17

Time on multi-core, multi-socket servers

Stokes Croft Graffiti, Sept 2015

In Distributed Computing the notion of "when-ness" is fundamental; Lamport's "Time, Clocks, and the. Ordering of Events in a Distributed System" paper is considered one of the foundational pieces of work.

But what about locally?

in the Java APIs, we have: System.currentTimeMillis() and System.nanoTime() to return time.

we experienced developers "know" that currentTimeMillis() is on the "wall clock", so that if things happen to that clock: manual/NTP clock shifts, VM migration, that time can suddenly jump to a new value. And for that reason, nanoTime() is the one that we should really be using to measure time, monotonically.

Except I now no longer trust it. I've known for a long time that CPU frequency could change its rate, but as of this week I've now discovered that on a multi-socket (And older multi-core system), the nanoTime() value may be or more of:

  1. Inconsistent across cores, hence non-monotonic on reads, especially reads likely to trigger thread suspend/resume (anything with sleep(), wait(), IO, accessing synchronized data under load).
  2. Not actually monotonic.
  3. Achieving a consistency by querying heavyweight counters with possible longer function execution time and lower granularity than the wall clock.
That is: modern NUMA, multi-socket servers are essentially multiple computers wired together, and we have a term for that: distributed system.

The standard way to read nanotime on an x86 part is reading the TSC counter, via the RDTSC opcode. Lightweight, though actually a synchronization barrier opcode.

Except every core in a server may be running at a different speed, and so have a different value for that counter. When code runs across cores, different numbers can come back.

In Intel's Nephalem chipset the TSC is shared across all cores on the same die, and clocked at a rate independent of the CPU: monotonic and consistent across the entire socket. Threads running in any core in the same die will get the same number from RDTSC —something that System.nanoTime() may use.

Fill in that second socket on your server, and you have lost that consistency, even if the parts and their TSC counters are running forwards at exactly the same rate. Any code you had which relied on TSC consistency is now going to break.

This is all ignoring virtualization: the RDSTC opcode may or may not be virtual. If it is: you are on your own.

Operating systems are aware of this problem, so may use alternative mechanisms to return a counter: which may be neither monotonic nor fast.

Here then, is some reading on the topic
The conclusion I've reached is that except for the special case of using nanoTime() in micro benchmarks, you may as well stick to currentTimeMillis() —knowing that it may sporadically jump forwards or backwards. Because if you switched to nanoTime(), you don't get any monotonicity guarantees, it doesn't relate to human time any more —and may be more likely to lead you into writing code which assumes a fast call with consistent, monotonic results.

2015-05-17

Distributed System Testing: where now, where next?

Confluent have announced they are looking for someone to work on an open source framework for distributed system testing.

I am really glad that they are sitting down to do this. Indeed, I've thought about sitting down to do it myself, the main reason I've been inactive there is "too much other stuff to do".

Crayola

Distributed System Testing is the unspoken problem of Distributed Computing. In single-host applications, all you need to do is show that the application "works" on the target system, with its OS,  enviroment (timezone, locale, ...), installed dependencies and application configuration.

In modern distributed computing you need to show that the distributed application works across a set of machines, in the presence of failures.

Equally importantly: when your tests fail, you need the ability to determine why they failed.

I think there is much scope to improve here, as well as the fundamental problem: defining works in the context of distributed computing.

I should write a post on that in future. For now, my current stance is: we need stricter specification of desired observable behaviour and implementation details. While I have been doing some Formal Specification work within the Hadoop codebase, there's a lot more work to be done there —and I can't do it all myself.

Assuming that there is a good specification of behaviour, you can then go on to defining tests which observe the state of the system, within the configuration space of the system (now including multiple hosts and the network), during a time period in which failures occur. The observable state should continue to match the specification, and if not, you want get the logs to determine why not. Note here that "observed state" can be pretty broad, and includes
  • Correct processing of requests
  • The ability to serialize an incoming stream of requests from multiple clients (or at least, to not demonstrate non-serialized behaviour)
  • Time to execute operations is one (performance),
  • Ability to support the desired request rate (scalability)
  • Persistence of state, where appropriate
  • Reslience to failures of : dependent services, network, hosts, 
  • Reporting of detected failure conditions to users and machines (operations needs)
  • Ideally: ability to continue in the presence of byzantine failures. Or at least detect them and recover.
  • Ability to interact with different versions of software (clients, servers, peers)
  • Maybe: ability to interact with different implementations of the same protocol.
I've written some slides on this topic, way back in 2006, Distributed Testing with SmartFrog. There's even a sub-VGA video to go with it from the 2006 Google Test Automation Conference.

My stance there was
  1. Tests themselves can be viewed as part of a larger distributed system
  2. They can be deployed with your automated deployment tools, bonded to the deployed system via the configuration management infrastructure
  3. You can use the existing unit test runners as a gateway to these tests, but reporting and logging needs to be improved.
  4. Data analysis is a critical area to be worked on.
I didn't look at system failures, I don't think I was worry enough about that, showing we weren't deploying things at scale, and before cloud computing took failures mainstream. Nowadays nobody can avoid thinking about VM loss at the very least.

Given I did those slides nine years ago, have things improved? Not much, no
  • Test runners are still all generating the Ant XML test reports written along with the matching XSLT transforms up by Stephane Balliez in 2000/2001
  • Continuous Integration servers have got a lot better, but even Jenkins, wonderful as it is, presents results as if they were independent builds, rather than a matrix of (app, environment, time). We may get individual build happiness, but we don't get reports  by test, showing that Hadoop/TestATSIntegrationFailures is working intermittently on all debian systems -but has been reliable elsewhere. The data is all there, but the reporting isn't.
  • Part of the problem is that they are still working with that XML format, one that, due to its use of XML attributes to summarise the run, buffers things in memory until the test test case finishes, then writes out the results. stdout and stderr may get reported -but only for the test client, and even then, there's no awareness of the structure of log messages
  • Failure conditions aren't usually being explicitly generated. Sometimes they happen, but then its complaints about the build or the target host being broken.
  • Email reports from the CI tooling is also pretty terse. You may get the "build broken, test XYZ with commits N1-N2", but again, you can get one per build, rather than a summary of overall system health.
  • With a large dependent graph of applications (hello, Hadoop stack!), there's a lot of regression testing that needs to take place —and fault tracking when something downstream fails. 
  • Those big system tests generate many, many logs, but they are often really hard to debug. If you haven't spent time with 3+ windows trying to sync up log events, you've not been doing test runs.
  • In a VM world, those VMs are often gone by the time you get told there's a problem.
  • Then there's the extended life test runs, the ones where we have to run things for a few days with Kerberos tokens set to expire hourly, while a set of clients generate realistic loads and random servers get restarted.
Things have got harder: bigger systems, more failure modes, a whole stack of applications —yet testing hasn't kept up.

In slider I did sit down to do something that would work within the constraints of the current test runner infrastructure yet still let us do functional tests against remote Hadoop clusters of variable size . Our functional test suite, funtests, uses Apache Bigtop's script launcher to start  Slider via its shell/py scripts. This tests those scripts on all test platforms (though it turns out, not enough locales), and forces us to have a meaningful set of exit codes —enough to distinguish the desired failure conditions from unexpected ones. Those tests can deploy slider applications on secure/insecure clusters (I keep my VM configs on github, for the curious), deploy test containers for basic operations, upgrade test, failure handling tests. For failure generation our IPC protocol includes messages to kill a container, and to have the AM kill itself with a chosen exit code.

For testing slider-deployed HBase and accumulo we go one step further. Slider deploys the application, and we run the normal application functional test suites with slider set up to generate failures.

How do we do that? With the Slider Integral Chaos Monkey. That's something which can run in the AM, and, at a configured interval, roll some virtual dice to see if the enabled failure events should be triggered: currently container and AM (we make sure the AM isn't chosen in the container kill monkey action, and have a startup delay to let the test runs settle in before starting to react).

Does it work? Yes. Which is good, because if things don't work, we've got the logs of all the machines in the cluster that ran slider to go through. Ideally, YARN-aggregated logs would suffice, but not if there's something up between YARN and the OS.

So: test runner I'm happy with. Remote deployment, failure injection, both structured and random. Launchable from my deskop and CI tooling; tests can be designed to scale. For testing rolling upgrades (Slider 0.80-incubating feature), we run the same client app while upgrading the system. Again: silence is golden.

Where I think much work needs to be done is what I've mentioned before: the reporting of problems and the tooling to determine why a test has failed.

We have the underlying infrastructure to stream logs out to things like HDFS or other services, there's nothing to stop us writing code to collect and aggregate those -with the recipient using the order of arrival to place an approximate time on events (not a perfect order, obviously, but better than log events with clocks that are wrong). We can collect those entire test run histories, along with as much environment information that we could grab and preserve. Junit: system properties. My ideal: VM snapshots & virtual network configs.

Then we'd go beyond XSLT reports of test runs and go to modern big data analysis tools. I'm going to propose here: Spark Why? so you can do local scripts, things in Jenkins & JUnit, and larger bulk operations. And for that get-your-hands-dirty test-debug festival, I can use a notebook like Apache Zepplin (incubating) can then be a no

we should be using our analysis tools for the automated analysis and reporting of test runs, the data science tooling for the debugging process.

Like I said, I'm not going to do all this. I will point to a lovely bit of code by Andrew Or @ databricks, spark-test-failures. which gets Jenkins's JSON-formatted test run history, determines flaky tests and posts the results on google docs. That's just a hint of what is possible —yet it shows the path forwards.

(Photo: "crayola", St Pauls:work commissioned by the residents)

2014-01-15

Greylisting - like blacklisting only more forgiving

How not to fix a car


Reading the paper  The φ Accrual Failure Detector has made me realise something that I should have recognised before: blacklisting errant nodes it too harsh -we should be assigning a score to them and then ordering them based on perceived reliability, rather than a simple reliable/unreliable flag.

In particular: the smaller the cluster, the more you have to make do with unreliable nodes. It doesn't matter if your car is unreliable, if it is all you have. You will use it, even if it means you end up trying to tape up an exhaust in a car park in Snowdonia, holding the part in place with a lead acid battery mistakenly placed on its side.

Similarly, on a 3-node cluster, if you want three region servers on different nodes, you have to accept that they all get in, even if sometimes unreliable.

This changes how you view cluster failures. We should track the total failures over time, and some weighted moving average of recent failures -the latter to give us a score of unreliability, giving us a reliability score of 1-reliability, assuming I can normalise unreliability to a floating point value in the range 0-1.

When specifically requesting nodes, we only ask for those with a recent reliability over a threshold; when we get them back we first sort for reliability and try to allocate all role instances to the most reliable nodes (sometimes YARN gives you more allocations than you asked for). We may have some allocations on nodes > the reliability threshold.
That threshold will depend on cluster size -we need to tune that based on the cluster size provided by the RM (issue: does it return current cluster size or maximum cluster size).

What to do with allocations above the threshold?
options
  1. discard them, ask for a new instance immediately: high risk of receiving the old one again
  2. discard them, wait, then ask for a new instance: lower risk.
  3. ask for a new instance before discarding the old one the soonest of (when the new allocation comes in, some time period after making the request). This probably has the lowest risk precisely because if there is capacity in the cluster we can't get that old container, we'll get a new one on an arbitrary node. If there isn't capacity, when we release the container some time period after making the request, we get it back again. That delayed release is critical to ensuring we get something back if there is no space.
What to do if we get the same host back again? Maybe just take what we are given, especially in case #3 and we know that the container was released after a timeout. It'll be above the threshold, but let's see what happens -it may just be that now it works (Some other service blocking a port has finished, etc). And if not, it gets marked as more unreliable.

If we do start off giving all nodes a reliability of under 100%, then we can even distinguish "unknown" from "known good" and "known unreliable". This gives applications a power they don't have today -a way to not trust the as-yet-unknown parts of a cluster

 If using this for HDD monitoring, I'd certainly want to consider brand new disks as less than 100% reliable at first, and try to avoid storing data in >1 drive below a specific reliability threshold, though that just makes block placement even more complex


I like this design --I just the need the relevant equations

2013-02-19

Load balancing, distribution and failure modes of distributed applications

Madrid

I've just been catching up on the RapGenius/Heroku row: that Heroku's load distribution algorithm "random placement" was killing performance as requests were still be routed to blocked worker nodes -dynos.

It's an interesting problem -to me, the failure to explain this to customers is indefensible. It's not an unexpected problem, it's an intrinsic part of the architecture, so talk about it sooner rather than later.

Madrid

What about the actual "random distribution of incoming requests" architecture?
  • Eliminates the need to share queue statistics to the front end nodes, so scales better with the #of front end and back end nodes.
  • If all requests take a similarish time to execute (some normal distribution with no long tail), and incoming requests have their own predictable style (say poisson distribution), then scattered scheduling should work well. You've got independent incoming requests being scattered out to a pool of workers that will get their work done. Scattering the work randomly leads to a balanced spreading of the load from each front-end node, if all front-end nodes choose a different set of random nodes at each time t, then the total work on the system gets distributed.
Assuming the incoming request rate for any particular time of day & day of week follows a specific poisson distribution, you could calculate the rate of requests needing serviced, combine that with the service processing distribution and estimate how many worker nodes you'd need for your SLA.

Where does it fail?
  1. If the front end nodes aren't random enough  -they keep picking the same workers and building up queues there.
  2. If the front end nodes aren't independently random -instead they are picking the same nodes as others, while leaving others idle. Again queues build up.
  3. If failed worker nodes aren't detected.
  4. If the time for worker nodes to complete a request has a long-tail built in to some of the requests, so causing some requests to take up much more time, so reducing throughput on that node.
  5. If overloaded worker nodes aren't detected, and queues build up worse there.

#4 & #5: long-tail requests with requests still hitting the overloaded worker nodes appears to be the problem hitting rapgenius. And once those queues build up, it takes a long time for them to go away: latency sucks.

What could be done here?
  1. worker nodes to provide queue information to the front-end nodes, they could pick two or three workers and route to the one with the shortest queue. Needs: protocol to poll before submitting; assumes that polling 3 nodes is enough to find one that isn't overloaded.
  2. tuple-space style "who wants this work?" scattered requests: any of the worker nodes can accept a request based on its workload. This is a pull model rather than a push model. Needs: a T-space that can handle the rate of change.
  3. Something central to collect workload stats and share it with the front end nodes. Needs: something central, data collection & publishing.
  4. Workers to publish their queue details to something distributed (T-Space or multicast load details), front-end nodes to collect this and use it in their decision making.
There: lots of choices. I shall wait to see what Heroku come up with.  Given their existing front-end-push model, I could see #1: check queues on >1 worker, or #4, workers to publish load, being most appealing, with #1 the simplest.

Before everyone goes "that's obvious! Why didn't they think of it!", a cautionary tail.

Way back in 2001, working on one of the early Web Services, XMLRPC requests would come in to some Level7 load balancing thing that would then direct work to the app server back ends processing it. Those machines would talk to other services in the cluster, and return the responses.

Except one day, one of the JVMs failed to find one of the nodes it depended on; some transient DNS failure. Of course, as we all now know, Java caches DNS failures unless you tell it not to: that transient failure was uprated to a permanent failure.

As a result, incoming XMLRPC requests did end up getting serviced very quickly -they were serviced by being turned into failure responses and sent back to the caller.

Which meant that the queue for that app server was significantly shorter than for all the other nodes in the cluster.

Which meant that the L7 router directed more work its way -amplifying a failure from, say 1in 8 requests, to about 1 in 2.

The front end router didn't know that the requests were failing, all it knew was that the observed liveness of the app server "fields requests, returns responses" seemed valid. It was fulfilling its goal of "send work to the machines with the shortest queue".

It was just unfortunate that the machine with the shortest queue wasn't actually live, in the strict "performing useful work" definition of liveness.

That's why a random distribution of requests has some appeal to me: not only is it simpler, it avoids that failure-amplification which we encountered, where fast-failing requests create the illusion of a shorter queue.

As a fun exercise, consider what it would take to automate detection of the failed node. It's not enough for the L7 router to observe that HTTP 500 responses are coming back, because a series of invalid requests could trigger that. You need to submit valid requests to the application from outside, and, if any of them fail, track down which worker node is playing up.

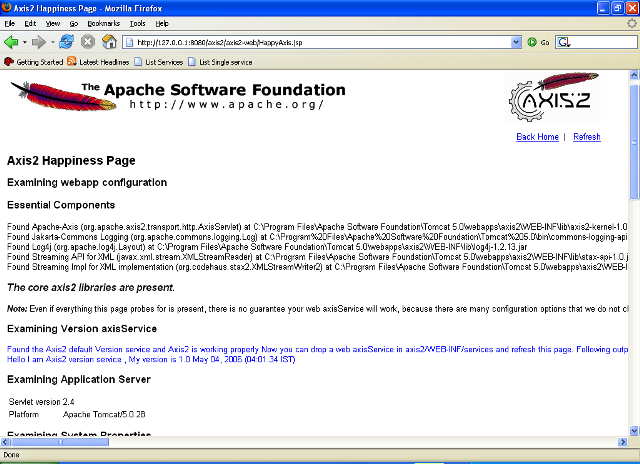
That, for the curious, is precisely why Apache Axis has  two features that I added based on my experiences here.

1. a health page, happyaxis.jsp.This gives the system state, returns 200 if happy, 500 if not -for the things upstream to react to- and is designed for humans to parse too.


2. The other feature, which is much less obvious, is that Axis can include the hostname in an AxisFault; with its addHostnameIfNeeded() method, a hostname may be returned to the caller. If enabled, you can push down some of the fault diagnostics to the clients, as people phone you up saying "I am getting failures from 'host4'", rather than them phoning you up saying "One request in eight is failing". Your remote automated liveness tests submitting reference work will now let you track down this problem without waiting for the call -or looking at the request logs to see which box has the problems. In a virtual world, rm that VM.

Anyway, the key points are this.
  1. Random distribution of workload is both simpler to implement, and somewhat resilient to some failure modes that convert to shorter request queues.
  2. Adding diagnostics to error responses aids in tracking down problems.
On reflection, I think it was that project where my obsession with useful network diagnostics came from.

Update: I've thought of another way to identify an overloaded worker node.
  1. Have each worker node declare its (moving) average service interval from accepting onto the queue to completion.
  2. Have the front-end servers maintain a moving average of the service interval declared by the last few worker nodes given work.
  3. The front end servers pick a worker node at random, as before.
  4. Include a query of the service interval & queue depth into the request forwarding protocol. The front end servers connect to a node in the back, ask it's for it's service interval, then decide whether or not to forward the request.
  5. The front end node can then implement a local policy for job submission that takes into account the current quoted service interval of the selected worker node in comparison with its moving average of job submissions. If the interval is significantly higher, the front-end node may choose to try another worker node to see if its interval is significantly less than that of the first node probed. If so, work could be sent there -and the moving average updated.
This approach doesn't add any more communications if all is working well (the load info can go into the first TCP ACK packet), and is entirely distributed. It's also a very simple evolution of the random distribution strategy.

[photo: a giant lizard made out of old CDs on a building in Madrid]