Showing posts with label testing. Show all posts

2017-04-12

Mocking: an enemy of maintenance

Bristol spring

I'm keeping myself busy right now with HADOOP-13786, an O(1) committer for job output into S3 buckets. The classic filesystem relies on rename() for that, but against S3 rename is a file-by-file copy whose time is O(data) and whose failure mode is "a mess", amplified by the fact that an inconsistent FS can create the illusion that destination data hasn't yet been deleted: false conflict.
. This creates failures like SPARK-18512., FileNotFoundException on _temporary directory with Spark Streaming 2.0.1 and S3A, as well as long commit delays.

I started this work a while back, making changes into the S3A Filesystem to support it. I've stopped focusing on that committer, and instead pulled in the version which Netflix have been using, which has the advantages of a thought out failure policy, and production testing. I've been busy merging that with the rest of the S3A work, and am now at the stage where I'm switching it over to the operations I've written for the first attempt, the "magic committer". These are in S3A, where they integrate with S3Guard state updates, instrumentation and metrics, retry logic, etc etc. All good.

The actual code to do the switchover is straightforward. What is taking up all my time is fixing the mock tests. These are failing with false positives "I've broken the code", when really the cause is "these mock tests are too brittle". In particular, I've had to rework how the tracking of operations goes, as a Mock Amazon S3Ciient is no longer used by the committer, instead its associated with the FS instance, which then is shared by all operations in a single test method. And the use of S3AFS methods shows up where its failing due to the mock instance not initing properly. I ended up spending most of Tuesday simply implementing the abort() call, now I'm doing the same on commit(). The production code switches fine, it's just the mock stuff.

This has really put me off mocking. I have used it sporadically in the past, and I've occasionally had to work other people's. Mocking has some nice features
  • Can run in unit tests which don't need AWS credentials, so Yetus/Jenkins can run them on patches.
  • Can be used to simulate failures and validate outcomes.
But the disadvantage is I just think they are too high maintenance. One test I've already migrated to being an integration test against an object store; I retained the original mock one, but just deleted that yesterday as it was going to be too expensive to migrate, and, with
that IT test, obsolete.

The others, well: the changes for abort() should help, but every new S3A method that gets called triggers new problems which I need to address. This is, well, "frustrating".

It's really putting me off mocking. Ignoring the Jenkins aspect, the key benefit is structure fault injection. I believe I could implement that in the IT tests too, at least in those tests which run in the same JVM. If I wanted to, I could probably even do it in the forked VMs by f propagating details on the desired failures to the processes. Or, if I really wanted to be devious, by running an HTTP proxy in the test VM and simulating network failures for the AWS client code itself to hit. That wouldn't catch all real-world problems (DNS, routing), but I could raise authentication, transient HTTP failures, and of course, force in listing inconsistencies. This is tempting, because it will help me qualify the AWS SDK we depend on, and could be re-used for testing the Azure storage too. Yes, it would take effort —but given the cost of maintaining those Mock tests after some minor refactoring of the production code, it's starting to look appealing.

(photo: Garage door, Greenbank, Bristol)

2016-09-09

Scalatest: thoughts and ideas

Spark uses Scalatest for its testing.

I alternate between "really liking this" and "bemoaning aspects of it".

Overall: I think the test language is better than JUnit, especially once you embrace more of the scala language. But the test execution could be improved, especially maven integration, and, to a lesser extent, that test reporting.

France 2016

Likes


eventually()


  eventually(timeout, policy) { closure };

This does a busy wait for the closure to complete (i.e. not throw an exception), policies include exponential backoff.

Pro: easy to write clauses in a test case which block until a state is reached or things timeout

Con: there's no way by default for those clauses to declare that they will never complete. That happens, especially if you are waiting for some state such as the number of events to be exactly 3 in a queue. If the queue size goes to 4, it's never going to drop to 3, so the clause could fail fast.

I think the fix there would be to define a specific "unrecoverable assertion failure" exception and raise that, have "eventually()" not swallow them.


the === check,


 assert(3 === events.queueSize)

This does good reporting on what the values are on an equality failure. It does need rigorousness about the order; I follow the junit assertEquals policy of expected-value-first. Projects really need a style guide/policy here.

Weakness: no typechecking at compile time. Better get those types right. Though as your tests should run through all assertions unless it is somehow nondeterministic, you'll find out soon enough.

Intercept:


  val ex = intercept[IOException.class] {
    doSomethingThatShouldRaiseAnIOE()
  }
  assert(ex.contains("host"), s"no 'host' in $ex")

Here there's a straightforward catch of a specific type (and failure raised if it didn't happen). As the exception is returned, the test case can continue. And with string formatting with the s"" syntax, reasonable groovy-esque diagnostics.


Matchers and the declarative specification syntax


  update("submissions") should be(5)

Ignoring the fact that the RFC2517 means that the syntax ought to be "must" and not "should", this style is fairly similar to JUnit 4 matchers, which is not something I ever do much of.

Pro: looks nicer than assert() clauses
weaknesses: you can add more details in assert() clauses —provided you sit down and do it.


Could try harder


the before and after mechanisms:, beforeclass and afterclass


While seems and easy way to declare things to run before tests, it doesn't work well with traits/mixins. In contrast, having setup() and teardown() methods, combined with Scala's strict order of evaluating traits and what what "super.setup()" would mean in a trait, allows you to write tests with traits where different traits can execute their setup/teardown clauses in a deterministic manner. Note that JUnit's before/after stuff is also a bit ambiguous, so it's not a denunciation of Scalatest here —more a commentary of the setup problem.

ignoring tests.


I've ended up doing this in the tests for spark-cloud, writing a conditional ctest() function. The secret there is to know that the test(name) { closure } declaration is not declaring a method, as in JUnit, but simply declaring an invocation of the test() method —an invocation which takes place during the construction of an instance of the test suite. There is nothing to stop you wrapping that call in other mechanisms: extra conditions, dynamic parameters, etc. It's only a closure, you understand.

Maven integration


Needs better wildcard and test suite declarations. I've only just discovered the ability to include a string in the name of the test case to run:

mvt -Dtest=none '-Dsuites=org.apache.spark.deploy.history.HistoryServerSuite incomplete' ; say moo

This command
  • doesn't run any java tests (because -D test=none doesn't match anything)
  • runs every test in HistoryServerSuite which has the world "incomplete" in the title
  • says "moo" after, so I can get on with other things while scalac gets round to building things, scalatest to running them. This matters because Scalac is so, so slow.

Reporting

The test reporter "helpfully" strips off the stack trace on assertion failures, so you don't get the full stack. This seems a good idea, except in the special case "you have the assertions inside a method which your test cases call". Do that and you suddenly lose the ability to detect what's wrong because the stack trace has been stripped —all you get is the name of the utility method. Just give us the full stack and stop trying to be clever..

My new conditional test runner


Here, then , is my ctest() function to declare a test which is conditional on the state of the entire suite, and an optional extra per-test predicate

/**
* A conditional test which is only executed when the
* suite is enabled and the `extraCondition`
* predicate holds.
* @param name test name
* @param detail detailed text for reports
* @param extraCondition extra predicate which may be
* evaluated to decide if a test can run.
* @param testFun function to execute
*/
protected def ctest(
  name: String,
  detail: String = "",
  extraCondition: => Boolean = true)
  (testFun: => Unit): Unit = {
  if (enabled && extraCondition) {
    registerTest(name) {
      logInfo(s"$name\n$detail\n---------------")
      testFun
    }
  } else {
    registerIgnoredTest(name) {
      testFun
    }
  }
}


What is critical to know is that this ctest() function, is not declaring any function/method in the test suite. It's just a function invoked in the suite's constructor,  interpreted in the order of listing in the file, expected to register the associated closure for invocation.

The normal test() function registers the test; the new ctest() function takes some extra detail text (logged @ info, and when I do something about reporting, may make it to the HTML), a condition for optional execution and that closure. There's also a suite-wide enabled() predicate. This is something which can be subclassed or mixed-in through a tratit for configurable execution. As an example. there are object store tests for both S3A and Azure, which are only enabled if the relevant credentials have been supplied.

Here's a more complex example


private[cloud] class S3aLineCountSuite
  extends CloudSuite with S3aTestSetup {

  init()

  override def useCSVEndpoint: Boolean = true

  def init(): Unit = {
    if (enabled) {
      setupFilesystemConfiguration(conf)
    }
  }

  override def enabled: Boolean = super.enabled

     && hasCSVTestFile

  ctest("S3ALineCountReadData",
    "Execute the S3ALineCount example") {
    val sparkConf = newSparkConf(CSV_TESTFILE.get)
    sparkConf.setAppName("S3ALineCountDefaults")
    assert(0 === S3LineCount.action(sparkConf, Seq()))
  }
}


The enabled predicate is true if the S3aTestSetup mixin was happy (that is, I've added credentials), and a CSV test file is defined. Then we run an example application, verifying
its exit code is 0.

Do I like this? Mostly.
 

Things I'm yet to explore


Async testing:

How to get the most out of scalatest 

(at least as far as I've learned so far)

  • Keep a strict ordering of (expected === actual). I use the same ordering as JUnit —I hope others are consistent there, as it's not so obvious in a test failure that things are different.
  • Add extra details in assert() clauses.
  • Embrace eventually()
  • Give every test case in a test suite a string which is at least partially unique. That way, you can run an individual test with the -Dsuite mechanism.
  • Try to make them fast. This really matters on spark, because there are a lot of tests to run.
  • If you are going near traits, have setup/teardown methods tagged as before {} and after{}, then use them through the traits consistently
  • Don't go too overboard in traits, even if you spent enough time in C++ to be perfectly comfortable with mixins and expect the maintainers to be happy with that too. As you can't make that latter expectation: use carefully.
  • Do try all the different spec mechanisms, rather than just stick with one because "it most reminds you of what you used to use". You could be missing out there
  • However: don't try all the different spec mechanisms wildly. Do try to be consistent with the rest of the project
Most of all: read the underlying source code. It's there. Look at what test(name) { clause } does and follow it through. See how tests are executed. Think about how to take best advantage of that in your test suites.

2016-06-16

No, you didn't want that stack trace


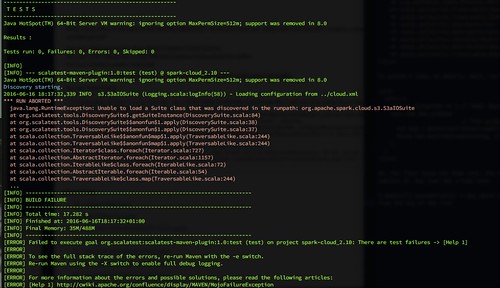
Tail of a test run.


Test failure

What am I doing today? End to end performance testing of the new S3A implementation. Or not.

2016-06-16 18:17:32,339 INFO  s3.S3aIOSuite (Logging.scala:logInfo(58)) -
 Loading configuration from ../cloud.xml
*** RUN ABORTED ***
  java.lang.RuntimeException: Unable to load a Suite class that was discovered in the
   runpath: org.apache.spark.cloud.s3.S3aIOSuite
  at org.scalatest.tools.DiscoverySuite$.getSuiteInstance(DiscoverySuite.scala:84)
  at org.scalatest.tools.DiscoverySuite$$anonfun$1.apply(DiscoverySuite.scala:38)
  at org.scalatest.tools.DiscoverySuite$$anonfun$1.apply(DiscoverySuite.scala:37)
  at scala.collection.TraversableLike$$anonfun$map$1.apply(TraversableLike.scala:244)
  at scala.collection.TraversableLike$$anonfun$map$1.apply(TraversableLike.scala:244)
  at scala.collection.Iterator$class.foreach(Iterator.scala:727)
  at scala.collection.AbstractIterator.foreach(Iterator.scala:1157)
  at scala.collection.IterableLike$class.foreach(IterableLike.scala:72)
  at scala.collection.AbstractIterable.foreach(Iterable.scala:54)
  at scala.collection.TraversableLike$class.map(TraversableLike.scala:244)

So, a test case wouldn't load. No details. Well, let's paste in the stack trace and see if the IDE will tell me where things went wrong.

catch {
  case e: Exception => {
    // TODO: Maybe include the e.getClass.getName
    // and the message for e in the message
    // cannotLoadDiscoveredSuite,
    // because Jess had the problem
    // That gradle cut off the stack trace so she
    // couldn't see the cause.
    val msg = Resources("cannotLoadDiscoveredSuite", suiteClassName)
    throw new RuntimeException(msg, e)   ***HERE ***
  }
}

Ah. The inner cause has been lost, whoever wrote the test runner knew this as someone called "Jess" complained. And the reaction was not to address it, but just add a TODO todo note.

I generally automatically -1 any patch whose test cases lose exception data. This test runner isn't quite doing that, but it is cutting the message from the top of the list, relying on the test reporter to display the whole list. Which, clearly, the scalatest reporter is not doing.

Having written a distributed JUnit runner in the distant path, I understand a key issue with test runners: they're hard to test. You essentially have to bootstrap your own testing infrastructure, then generate the failure conditions you see from tests. Which does mean: you get to stare at the stack traces. I think what we are seeing here is evidence that whoever is developing scalatest doesn't use maven.

This also shows what's wrong with TODO notes: they're technical debt you forget about.

At least if you keep adding more and more things to your issue tracker, you've got a nice shared graph of filed vs completed. Whose project tracks the number of TODO line items in a source tree?

(Update: found the problem. The test in question had a base class with an after{} cleanup clause, as did a mixed in trait. Whatever error message scalatest raises at that point, well, it doesn't make it through the testrunner unscathed)

2016-04-26

Distributed Testing: making use of the metrics


3Dom, St Werburghs

Summary

In this article I introduce the concept of Metrics-first Testing, and show how instrumenting the internals of classes, enabling them to be published as metrics, enables better testing of distributed systems, while also offering potential to provide more information in production.

Exporting instrumented classes in the form of remotely accessible metrics permits test runners to query the state of the System Under Test, both to make assertions about its state, and to collect histories and snapshots of its state for post-run diagnostics.

This same observable state may be useful in production —though there is currently no evidence to support this hypothesis.

There are a number of issues with the concept. A key one is if these metrics do provde useful in production, then they become part of the public API of the system, and must be supported across future versions.

Introduction: Metrics-first Testing


I've been doing more scalatest work, as part of SPARK-7889, SPARK-1537, SPARK-7481. Alongside that, in SLIDER-82, anti-affine work placement across a YARN cluster, And, most recently, wrapping up S3a performance and robustness for Hadoop 2.8, HADOOP-11694, where the cost of an HTTP reconnect appears on a par with reading 800KB of data, meaning: you are better off reading ahead than breaking a connection on any forward seek under ~900KB. (that's transatlantic to an 80MB FTTC connection; setup time is fixed, TCP slow start also means that the longer the connection is held, the better the bandwidth gets)

On these projects, I've been exploring the notion of metrics-first testing. That is: your code uses metric counters as a way of exposing the observable state of the core classes, and then tests can query those metrics, either at the API level or via web views.

Here's a test for HADOOP-13047,: S3a Forward seek in stream length to be configurable

@Test
  public void testReadAheadDefault() throws Throwable {
    describe("Verify that a series of forward skips within the readahead" +
        " range do not close and reopen the stream");
    executeSeekReadSequence(32768, 65536);
    assertEquals("open operations in " + streamStatistics,
        1, streamStatistics.openOperations);
  }

Here's the output

testReadAheadDefault: Verify that a series of forward skips within the readahead
  range do not close and reopen the stream

2016-04-26 11:54:25,549 INFO  Reading 623 blocks, readahead = 65536
2016-04-26 11:54:29,968 INFO  Duration of Time to execute 623 seeks of distance 32768
 with readahead = 65536: 4,418,524,000 nS
2016-04-26 11:54:29,968 INFO  Time per IOP: 7,092,333 nS
2016-04-26 11:54:29,969 INFO  Effective bandwidth 0.000141 MB/S
2016-04-26 11:54:29,970 INFO  StreamStatistics{OpenOperations=1, CloseOperations=0,
  Closed=0, Aborted=0, SeekOperations=622, ReadExceptions=0, ForwardSeekOperations=622,
  BackwardSeekOperations=0, BytesSkippedOnSeek=20381074, BytesRead=20381697,
  BytesRead excluding skipped=623, ReadOperations=0, ReadsIncomplete=0}

I'm collecting internal metrics of a stream, and using that to make assertions about the correctness of the code. Here, that if I set the readahead range to 64K, then a series of seek and read operations stream through the file, rather than break and reconnect the HTTPS link.

This matters a lot, as shown by one of the other tests, which times an open() call as well as that to actually read the data

testTimeToOpenAndReadWholeFileByByte: Open the test file
  s3a://landsat-pds/scene_list.gz and read it byte by byte

2016-04-26 11:54:47,518 Duration of Open stream: 181,732,000 nS
2016-04-26 11:54:51,688 Duration of Time to read 20430493 bytes: 4,169,079,000 nS
2016-04-26 11:54:51,688 Bandwidth = 4.900481  MB/S
2016-04-26 11:54:51,688 An open() call has the equivalent duration of
  reading 890,843 bytes

Now here's a Spark test using the same source file and s3a connector

ctest("CSVgz", "Read compressed CSV", "") {
    val source = sceneList
    sc = new SparkContext("local", "test", newSparkConf(source))
    val sceneInfo = getFS(source).getFileStatus(source)
    logInfo(s"Compressed size = ${sceneInfo.getLen}")
    val input = sc.textFile(source.toString)
    val (count, started, time) = duration2 {
      input.count()
    }
    logInfo(s" size of $source = $count rows read in $time nS")
    assert(ExpectedSceneListLines <= count)
    logInfo(s"Filesystem statistics ${getFS(source)}")
  }

Which produces, along with the noise of a local spark run, some details on what the FS got up to
2016-04-26 12:08:25,901  executor.Executor Running task 0.0 in stage 0.0 (TID 0)
2016-04-26 12:08:25,924  rdd.HadoopRDD Input split: s3a://landsat-pds/scene_list.gz:0+20430493
2016-04-26 12:08:26,107  compress.CodecPool - Got brand-new decompressor [.gz]
2016-04-26 12:08:32,304  executor.Executor Finished task 0.0 in stage 0.0 (TID 0). 
  2643 bytes result sent to driver
2016-04-26 12:08:32,311  scheduler.TaskSetManager Finished task 0.0 in stage 0.0 (TID 0)
  in 6434 ms on localhost (1/1)
2016-04-26 12:08:32,312  scheduler.TaskSchedulerImpl Removed TaskSet 0.0, whose tasks
  have all completed, from pool 
2016-04-26 12:08:32,315  scheduler.DAGScheduler ResultStage 0 finished in 6.447 s
2016-04-26 12:08:32,319  scheduler.DAGScheduler Job 0 finished took 6.560166 s
2016-04-26 12:08:32,320  s3.S3aIOSuite  size of s3a://landsat-pds/scene_list.gz = 464105
  rows read in 6779125000 nS

2016-04-26 12:08:32,324 s3.S3aIOSuite Filesystem statistics
  S3AFileSystem{uri=s3a://landsat-pds,
  workingDir=s3a://landsat-pds/user/stevel,
  partSize=104857600, enableMultiObjectsDelete=true,
  multiPartThreshold=2147483647,
  statistics {
    20430493 bytes read,
     0 bytes written,
     3 read ops,
     0 large read ops,
     0 write ops},
     metrics {{Context=S3AFileSystem}
      {FileSystemId=29890500-aed6-4eb8-bb47-0c896a66aac2-landsat-pds}
      {fsURI=s3a://landsat-pds/scene_list.gz}
      {streamOpened=1}
      {streamCloseOperations=1}
      {streamClosed=1}
      {streamAborted=0}
      {streamSeekOperations=0}
      {streamReadExceptions=0}
      {streamForwardSeekOperations=0}
      {streamBackwardSeekOperations=0}
      {streamBytesSkippedOnSeek=0}
      {streamBytesRead=20430493}
      {streamReadOperations=1488}
      {streamReadFullyOperations=0}
      {streamReadOperationsIncomplete=1488}
      {files_created=0}
      {files_copied=0}
      {files_copied_bytes=0}
      {files_deleted=0}
      {directories_created=0}
      {directories_deleted=0}
      {ignored_errors=0} 
      }}

What's going on here?

I've instrumented S3AInputStream, instrumentation which is then returned to its S3AFileSystem instance.
This instrumentation can not only be logged, it can be used in assertions.

And, as the FS statistics are actually Metrics2 data, they can be collected from running applications.

By making the observable state of object instances real metric values, I can extend their observability from unit tests to system tests —all the way to live clusters.

  1. This makes assertions on the state of remote services a simple matter of GET /service/metrics/$metric + parsing.
  2. It ensures that the internal state of the system is visible for diagnostics of both test failures and production system problems. Here: how is the file being accessed? Is the spark code seeking too much —especially backwards? Were there any transient IO problems which were recovered from?
    These are things which the ops team may be grateful for in the future, as now there's more information about what is going on.
  3. It encourages developers such as myself to write those metrics early, at the unit test time, because we can get immediate tangible benefit from their presence. We don't need to wait until there's some production-side crisis and then rush to hack in some more logging. Classes are instrumented from the outset. Indeed, in SPARK-11373 I'm actually implementing the metrics publishing in the Spark History server —something the SPARK-7889 code is ready for.
Metrics-first testing, then, is instrumenting the code and publishing it for assertions in unit tests, and for downstream test suites.

I'm just starting to experiment with this metrics-first testing.

I have ambitions to make metric capture and monitoring a more integral part of test runs. In particular, I want test runners to capture those metrics. That's either by setting up the services to feed the metrics to the test runner itself, capturing the metrics directly by polling servlet interfaces, or capturing them indirectly via the cluster management tools.

Initially that'll just be a series of snapshots over time, but really, we could go beyond that and include in test reports the actual view of the metrics: what happened to various values over time? when when Yarn timeline server says its average CPU was at 85%, what was the spark history server saying its cache eviction rate was?

Similarly, those s3a counters are just initially for microbenchmarks under hadoop-tools/hadoop-aws, but they could be extended up the stack, through Hive and spark queries, to full applications. It'll be noisy, but hey, we've got tooling to deal with lots of machine parseable noise, as I call it: Apache Zeppelin.

What are the flaws in this idea?


Relevance of metrics beyond tests.


There's the usual issue: the metrics we developers put in aren't what the operations team need. That's inevitable, but at least we are adding lots of metrics into the internal state of the system, and once you start instrumenting your code, you are more motivated to continue to add the others.


Representing Boolean values


I want to publish a boolean metric: has the slider App Master had a node map update event from the YARN RM? That's a bool, not the usual long value metrics tools like. The fix there is obvious for anyone who has programmed in C:
public class BoolMetric extends AtomicBoolean implements Metric, Gauge<integer> {

  @Override
  public Integer getValue() {
    return get() ? 1 : 0;
  }
It's not much use as a metric, except in that case that you are trying to look at system state and see what's wrong. It actually turns out that you don't get an initial map —something which GETs off the Coda Hale JSON metric servlet did pick up in a minicluster test. It's already paid for itself. I'm happy. It's just it shows the mismatch between what is needed to monitor a running app, things you can have triggers and graphs of, and simple bool state view.


Representing Time


I want to track when an update happened, especially relative to other events across the system. I don't see (in the Coda Hale metrics) any explicit notion of time other than histograms of performance. I want to publish a wall time, somehow. Which leaves me with two options. (a) A counter listing the time in milliseconds *when* something happened. (b) A counter listing the time in milliseconds *since* something happened. From a monitoring perspective, (b) is better: you could set an alarm if the counter value went over an hour.

From a developer perspective, absolute values are easier to test with. They also support the value "never" better, with something "-1" being a good one here. I don't know what value of "never" would be good in a time-since-event value which couldn't be misinterpreted by monitoring tools. A value of -1 could be construed as good, though if it had been in that state for long enough, it becomes bad. Similarly, starting off with LONG_MAX as the value would set alarms off immediately. Oh, and either way, the time isn't displayed as a human readable string. In this case I'm using absolute times.

I'm thinking of writing a timestamp class that publishes an absolute time on one path, and a relative time on an adjacent path. Something for everyone


 The performance of AtomicLongs


Java volatile variables are slightly more expensive than C++ ones, as they act as barrier operations rather than just telling the compiler never to cache them. But they are still simple types.

In contrast, Atomic* are big bits of Java code, with lots of contention if many threads try to update some metric. This is why Coda Hale use a an AtomicAccumulator class, one that eventually surfaces in Java 8..

But while having reduced contention, that's still a piece of java code trying to acquire and release locks.

It would only take a small change in the JRE for volatile, or perhaps some variant, atomic to implement atomic ++ and += calls at the machine code level, so the cost of incrementing a volatile would be almost the same as setting it.

We have to assume that Sun didn't do that in 1995-6 as they were targeting 8 bit machines, where even incrementing a 16 bit short value was not something all CPUs could guarantee to do atomically.

Nowadays, even watches come with 32 bit CPUs; phones are 64 bit. It's time for Oracle to look ahead and conclude that it's time for even 64 bit volatile addition to made atomic.

For now, I'm making some of the counters which I know are only being updated within thread-safe code (or code that says "should only be used in one thread") volatile; querying them won't hold up the system.


 Metrics are part of your public API


This is the troublesome one: If you start exporting information which your ops team depends on, then you can't remove it. (Wittenauer, a reviewer of a draft of this article, made that point quite clearly). And of course, you can't really tell which metrics end up being popular. Not unless you add metrics for that, and, well, you are down a slippery slope of meta-metrics at that point.

The real issue here becomes not exposing more information about the System Under Test, but exposing internal state which may change radically across versions.

What I'm initially thinking of doing here is having a switch to enable/disable registration of some of the more deeply internal state variables. The internal state of the components are not automatically visible in production, but can be turned on with a switch. That should at least make clear that some state is private.

However, it may turn out that the metrics end up being invaluable during troubleshooting; something you may not discover until you take them away.

Keeping an eye on troubleshooting runbooks and being involved in support calls will keep you honest there.


Pressure to align your counters into a bigger piece of work


For the S3a code, this surfaces in HDFS-10175; a proposal to make more of those FS level stats visible, so that at the end of an SQL query run, you can get aggregate stats on what all filesystems have been up to. I do think this is admirable, and with the costs of an S3 HTTP reconnect being 0.1s, it's good to know how many there are.

At the same time, these overreaching goals shouldn't be an excuse to hold up the low level counters and optimisations which can be done at a micro level —what they do say is "don't make this per-class stuff public" until we can do it consistently. The challenge then becomes technical: how to collect metrics which would segue into the bigger piece of work, are useful on their own, and which don't create a long term commitment of API maintenance.


Over-instrumentation


As described by Jakob Homan: " Large distributed systems can overwhelm metrics aggregators.  For instance, Samza jobs generated so many metrics LI's internal system blanched and we had to add a feature to blacklist whole metric classes "

These low-level metrics may be utterly irrelevant to most processes, yet, if published and recorded, will add extra load to the monitoring infrastructure.

Again, this argues for making the low-level metrics off by default, unless explicitly enabled by a debugging switch.

In fact, it almost argues for having some metric enabling profile similar to log4J settings, where you could turn on, say, the S3a metrics at DEBUG level for a run, leaving it off elsewhere. That could be something to investigate further.

Perhaps I could start by actually using the log level of the classes as the cue to determine which metrics to register:
if (LOG.isDebugEnabled) {
    registerInternalMetrics();
}

Related work

I've been trying to find out who else has done this, and what worked/didn't work, but there doesn't seem too much in published work. There's a lot of coverage of performance testing —but this isn't that. This about a philosophy of instrumenting code for unit and system tests, using metrics as that instrumentation —and in doing so not only enabling better assertions to be made about the state of the System Under Test, but hopefully providing more information for production monitoring and diagnostics.

Conclusions

In Distributed Testing, knowing more about state of the System Under Test aids both assertions and diagnostics. By instrumenting the code better, or simply making the existing state accessible as metrics, it becomes possible to query that state during test runs. This same instrumentation may then be useful in the System In Production —though that it is something which I currently lack data about.

Acknowledgements

It's not often (ever?) that I get people to review blog posts before I publish them: this one I did as it's introducing concepts in system testing which impacts everything from code to production system monitoring. Thank you to the reviewers: Jakob Homan, Chris Douglas, Jay Kreps, Allen Wittenauer, Martin Kleppman.

I don't think I've addressed all their feedback, especially Chris's (security, scope,+ others), and Jay went into detail on how structured logging would be superior —something I'll let him expound on in the Confluent blog.

Interestingly, I am exposing the s3a metrics as log data, —it lets me keep those metrics internal, and lets me see their values in Spark tests without changing that code.

AW pointed out that I was clearly pretty naive in terms of what modern monitoring tools could do, and should do more research there: On first blush, this really feels naïve as to the state of the art of monitoring tools, especially in the commercial space where a lot of machine learning is starting to take shape (e.g., Netuitive, Circonus, probably Rocana, etc, etc). Clearly I have to do this...

(Artwork: 3Dom in St Werburgh's)


2016-04-15

Testing against S3 and object stores —keep your keys out of SCM

Nobody wants to commit their AWS credentials to an SCM repository, not when there are robots looking for your keys so they can spin up bitcoin mining VMs.
Sunday Morning St Werburghs

That's why git-secrets is something you should preinstall on all repos where you go near repositories. Unfortunately, it's pattern matching picks up a lot of invalid patterns in the Hadoop codebase, and a few in spark. In the absence of a decent pattern to only scan text files, after installing I edit out the regexps from .git/config and rely on it scanning purely for the strings in ~/.aws/credentials.

That keeps the keys out of SCM, if everyone is set up that way.

Which leaves the next problem: if you save your hadoop configuration files to SCM, how do you get AWS keys into system configurations?


The answer: XInclude


This is one of my configuration files, specifically hadoop-tools/hadoop-aws/src/test/resources/auth-keys.xml

This is a special file, tagged as .gitignore to keep it out of the repos. Yet still the keys are in that source tree, still at risk of sneaking out.

To deal with this, stick an absolute XInclude reference into the file, pointing to the configuration file where the keys really live.

<configuration>
  <include xmlns="http://www.w3.org/2001/XInclude"
    href="file:///home/stevel/.aws/hadoop-keys.xml" />
</configuration>


This tells the Hadoop config loader to grab the keys from a file in ~/.aws; one which lives carefully out of the SCM-managed space.

Provided the contents of that directory are kept private, my keys will not get checked in.

They can, however leak, in various ways, including
  • In the /config URL of a service
  • Code which accidentally logs it.
  • If it gets saved to files/datasets used in bug reports.
  • Malicious code running in your system which grabs the keys and exports/logs them. This is why no OSS jenkins servers are set up with the keys needed to test against object store.
Clearly, more should be done to lock it down.

There are some patches under the S3A phase 2 JIRA to support credentials better, [HADOOP-12723, HADOOP-12537]. This is somewhere where anyone who can test these patches is invaluable. I'm currently doing the review-then-commit in S3, but I'm only doing it at weekends, when I have some spare time, and even then, as a full test run takes 2+ hours, not reviewing very much.

Anyone can review Hadoop patches, confirm whether they worked or not, show how they didn't. It's the way to verify that forthcoming code from other people works for you, and of contributing time and effort into the community. Other people have done the coding —time to help with the testing.

Especially now I've just documented how to keep the keys safe when you set up S3 for a test run. Once the auth-keys.xml file is in the src/test/resources directory, Maven tests s3, depending on the specific properties, s3a, s3n and s3a are all tested.

Update: 2016-06-20: I've discovered that if you use the id:secret in a URL for an S3x filesystem, e.g s3a://AWS01:sec/ret@mybucket then the secrets get logged everywhere, because the Hadoop code assumes there aren't secrets in the Path or Filesystem URIs. We've cranked back a bit on the leakage (by stripping it from the FS URIs), but it still gets out everywhere. Fix: don't do that. Hadoop 2.8 will explicitly tell you off whenever you do so.

Update: 2018-02-07: Hadoop 2.9+ uses a more efficient Stax XML parser over a DOM based one. That broke this secret-sequestering somewhat dramatically. For Hadoop 2.9+, do not use the file: prefix

  <include xmlns="http://www.w3.org/2001/XInclude"
    href="///users/stevel/.aws/auth-keys.xml" >
  </include>

FWIW, it's possible to have base auth-key.xml with XIncludes which supports both parsers by having both references in the file, and add a <fallback/> element in both so an unresolvable ref is a no-op. Worth knowing if you need to test across all branches.

[photo: Mina Road Park, St Werburghs]

2015-05-21

It's OK to submit patches without tests: just show the correctness proofs instead


Bruxelles

In a window adjacent to the browser I'm typing this, I'm doing a clean build of trunk prior to adding a two line patch to Hadoop -and the 20+ lines needed to test that patch; Intellij burbles away for 5 minutes as it does on any changes to the POMs on a project which has a significant of the hadoop stack loaded.

The patch I'm going write is to fix a bug introduced by a previous three line patch, one that didn't come with patches because it was "trivial".

It may have been a trivial patch, but it was a broken trivial patch. It's not so much that the test cases would have found this, but they'd have forced the author to think more about the inputs to the two-line method, and what outputs would be expected. Then we get some tests that generate the desired outputs for the different outputs, ones that guarantee that over time the behaviour is constant.

Instead we have a colleague spending a day trying to track down a remote functional test run, one that has been reduced to a multi-hop stack trace problem. The big functional test suites did find that bug (good), but because the cost of debugging and isolating that failure is higher handling that failure is more expensive.; With better distributed test tooling, especially log aggregation and analysis, that cost should be lower —but it's still pretty needless for something that could have been avoided simply by thinking through the inputs.

Complex functional system tests should not be used as a substitute for unit tests on isolated bits of code. 

I'm not going to highlight the issue, or identify who wrote that patch, because it's not fair: it could be any of us, and I am just as guilty of submitting "trivial" patches. If something is 1-2 lines long, it's really hard to justify in your brain the effort of writing the more complex tests to go with it.


If the code actually works as intended, you've saved time and all is well. But if it doesn't, that failure shows up later in full stack tests (cost & time), the field (very expensive), and either way ends up being fixed the way the original could have been done.

And as documented many times before: it's that thinking about inputs & outputs that forces you to write good code.

Anyway: I have tests to write now, before turning on to what is the kind of problem where those functional tests are justified, such as Jersey client not working on Java 8. (I can replicate that in a unit test, but only in my windows server/java 8 VM)

In future, if I see anyone use "trivial patch" as a reason to not write tests, I'll be wheeling out the -1 veto.

I do however, offer an exception: if people can prove their code works, I'll be happy

(photo: wall in Brussels)

2015-05-17

Distributed System Testing: where now, where next?

Confluent have announced they are looking for someone to work on an open source framework for distributed system testing.

I am really glad that they are sitting down to do this. Indeed, I've thought about sitting down to do it myself, the main reason I've been inactive there is "too much other stuff to do".

Crayola

Distributed System Testing is the unspoken problem of Distributed Computing. In single-host applications, all you need to do is show that the application "works" on the target system, with its OS,  enviroment (timezone, locale, ...), installed dependencies and application configuration.

In modern distributed computing you need to show that the distributed application works across a set of machines, in the presence of failures.

Equally importantly: when your tests fail, you need the ability to determine why they failed.

I think there is much scope to improve here, as well as the fundamental problem: defining works in the context of distributed computing.

I should write a post on that in future. For now, my current stance is: we need stricter specification of desired observable behaviour and implementation details. While I have been doing some Formal Specification work within the Hadoop codebase, there's a lot more work to be done there —and I can't do it all myself.

Assuming that there is a good specification of behaviour, you can then go on to defining tests which observe the state of the system, within the configuration space of the system (now including multiple hosts and the network), during a time period in which failures occur. The observable state should continue to match the specification, and if not, you want get the logs to determine why not. Note here that "observed state" can be pretty broad, and includes
  • Correct processing of requests
  • The ability to serialize an incoming stream of requests from multiple clients (or at least, to not demonstrate non-serialized behaviour)
  • Time to execute operations is one (performance),
  • Ability to support the desired request rate (scalability)
  • Persistence of state, where appropriate
  • Reslience to failures of : dependent services, network, hosts, 
  • Reporting of detected failure conditions to users and machines (operations needs)
  • Ideally: ability to continue in the presence of byzantine failures. Or at least detect them and recover.
  • Ability to interact with different versions of software (clients, servers, peers)
  • Maybe: ability to interact with different implementations of the same protocol.
I've written some slides on this topic, way back in 2006, Distributed Testing with SmartFrog. There's even a sub-VGA video to go with it from the 2006 Google Test Automation Conference.

My stance there was
  1. Tests themselves can be viewed as part of a larger distributed system
  2. They can be deployed with your automated deployment tools, bonded to the deployed system via the configuration management infrastructure
  3. You can use the existing unit test runners as a gateway to these tests, but reporting and logging needs to be improved.
  4. Data analysis is a critical area to be worked on.
I didn't look at system failures, I don't think I was worry enough about that, showing we weren't deploying things at scale, and before cloud computing took failures mainstream. Nowadays nobody can avoid thinking about VM loss at the very least.

Given I did those slides nine years ago, have things improved? Not much, no
  • Test runners are still all generating the Ant XML test reports written along with the matching XSLT transforms up by Stephane Balliez in 2000/2001
  • Continuous Integration servers have got a lot better, but even Jenkins, wonderful as it is, presents results as if they were independent builds, rather than a matrix of (app, environment, time). We may get individual build happiness, but we don't get reports  by test, showing that Hadoop/TestATSIntegrationFailures is working intermittently on all debian systems -but has been reliable elsewhere. The data is all there, but the reporting isn't.
  • Part of the problem is that they are still working with that XML format, one that, due to its use of XML attributes to summarise the run, buffers things in memory until the test test case finishes, then writes out the results. stdout and stderr may get reported -but only for the test client, and even then, there's no awareness of the structure of log messages
  • Failure conditions aren't usually being explicitly generated. Sometimes they happen, but then its complaints about the build or the target host being broken.
  • Email reports from the CI tooling is also pretty terse. You may get the "build broken, test XYZ with commits N1-N2", but again, you can get one per build, rather than a summary of overall system health.
  • With a large dependent graph of applications (hello, Hadoop stack!), there's a lot of regression testing that needs to take place —and fault tracking when something downstream fails. 
  • Those big system tests generate many, many logs, but they are often really hard to debug. If you haven't spent time with 3+ windows trying to sync up log events, you've not been doing test runs.
  • In a VM world, those VMs are often gone by the time you get told there's a problem.
  • Then there's the extended life test runs, the ones where we have to run things for a few days with Kerberos tokens set to expire hourly, while a set of clients generate realistic loads and random servers get restarted.
Things have got harder: bigger systems, more failure modes, a whole stack of applications —yet testing hasn't kept up.

In slider I did sit down to do something that would work within the constraints of the current test runner infrastructure yet still let us do functional tests against remote Hadoop clusters of variable size . Our functional test suite, funtests, uses Apache Bigtop's script launcher to start  Slider via its shell/py scripts. This tests those scripts on all test platforms (though it turns out, not enough locales), and forces us to have a meaningful set of exit codes —enough to distinguish the desired failure conditions from unexpected ones. Those tests can deploy slider applications on secure/insecure clusters (I keep my VM configs on github, for the curious), deploy test containers for basic operations, upgrade test, failure handling tests. For failure generation our IPC protocol includes messages to kill a container, and to have the AM kill itself with a chosen exit code.

For testing slider-deployed HBase and accumulo we go one step further. Slider deploys the application, and we run the normal application functional test suites with slider set up to generate failures.

How do we do that? With the Slider Integral Chaos Monkey. That's something which can run in the AM, and, at a configured interval, roll some virtual dice to see if the enabled failure events should be triggered: currently container and AM (we make sure the AM isn't chosen in the container kill monkey action, and have a startup delay to let the test runs settle in before starting to react).

Does it work? Yes. Which is good, because if things don't work, we've got the logs of all the machines in the cluster that ran slider to go through. Ideally, YARN-aggregated logs would suffice, but not if there's something up between YARN and the OS.

So: test runner I'm happy with. Remote deployment, failure injection, both structured and random. Launchable from my deskop and CI tooling; tests can be designed to scale. For testing rolling upgrades (Slider 0.80-incubating feature), we run the same client app while upgrading the system. Again: silence is golden.

Where I think much work needs to be done is what I've mentioned before: the reporting of problems and the tooling to determine why a test has failed.

We have the underlying infrastructure to stream logs out to things like HDFS or other services, there's nothing to stop us writing code to collect and aggregate those -with the recipient using the order of arrival to place an approximate time on events (not a perfect order, obviously, but better than log events with clocks that are wrong). We can collect those entire test run histories, along with as much environment information that we could grab and preserve. Junit: system properties. My ideal: VM snapshots & virtual network configs.

Then we'd go beyond XSLT reports of test runs and go to modern big data analysis tools. I'm going to propose here: Spark Why? so you can do local scripts, things in Jenkins & JUnit, and larger bulk operations. And for that get-your-hands-dirty test-debug festival, I can use a notebook like Apache Zepplin (incubating) can then be a no

we should be using our analysis tools for the automated analysis and reporting of test runs, the data science tooling for the debugging process.

Like I said, I'm not going to do all this. I will point to a lovely bit of code by Andrew Or @ databricks, spark-test-failures. which gets Jenkins's JSON-formatted test run history, determines flaky tests and posts the results on google docs. That's just a hint of what is possible —yet it shows the path forwards.

(Photo: "crayola", St Pauls:work commissioned by the residents)

2015-04-18

Build tools as Proof Engines


Bristol@300mm

Someone has put up a thoughtful post on whether you can view make as a proof system. I thought about it and have come up with a conclusion: maybe in the past —but not any more.

As background, it's worth remembering
  1. I did "write the book on Ant", which is a build system in which you declare the transformational functions required to get your application into a state which you consider shippable/deployable, a set of functions which you define in a DAG for the Ant execution engine to generate and order from and then apply to your environment
  2. Early last year, in my spare time, I formally specified the Hadoop FS APIs in Spivey's Z notation, albeit in a Python syntax.
  3. In YARN-913 I went on to specify the desired behaviour of the YARN registry as a TLA+ specification.
And while I don't discuss it much, during my undergraduate work on Formal Specification of and implementation Microprocessors, I was using Gordon's HOL theorem prover. The latter based on Standard ML, just to fend off anyone who believed me when I was claiming not to understand functional programming earlier this week. I didn't meant it, it just entertained the audience. Oh, and did I mention I'm happy to write Prolog too?

This means that (a) I believe I understand about specifications, (b) I vaguely remember what a proof engine is, and (b) I understand how Prolog resolves things, and specifically, why "!" is the most useful operator when you are trying to write applications.

Now I note that the author of that first post, Bob Atkey, does not only has a background of formal logic, SML and possibly even worked with the same people as me, his knowledge is both greater and more up to date than mine. I just have more experience of breaking builds and getting emails from jenkins telling me this.

Now, consider a software project's build
  1. A set of source artifacts, S, containing artifacts s1..sn
  2. A declaration of the build process, B
  3. A set of external dependencies, libraries, L.
  4. A build environment, E., comprising the tools needed for the build, and the computer environment around them, including the filesystem, OS, etc.
The goal is to reach a desired state of a set of redistributables, R, such that you are prepared to ship or deploy them.

The purpose of the build system, then, is to generate R from S through a series of functions applied to (S, L) with tools T within the environment E. The build process description, B, defines or declares that process.

There's many ways to do that; a single line bash file cc *.c && cc *.o could be enough to compile the lexical analyser example from Ch02 of the dragon book.

Builds are more complex than that, which is where tools like make come in.

Make essentially declares that final list of redistributables, R, and a set of transformations from inputs artifacts to output artifacts, including the functions (actions by the tools) to generate the output artifacts from the input artifacts.

The make runtime looks at what artifacts exist, what are missing, and what are out of date somehow builds a chain of operations that are hypothesised to produce a complete set of output artifact whose timestamp in the filesystem is later than that of the source files.

It is interesting to look at it formally, with a rule saying that to derive .o from .c, a function "cc -c" is applied to the source. Make looks at the filesystem for the existence of that .o file, its absence or "out-of-dateness" and, if needed applies the function. If multiple rules are used to derive a sequence of transformations then make will build that chain then execute them.

One interesting question is "how does make build that series of functions, f1..fn, such that:

R = fn(fn-1(fn-2(fn-3..f1(S, L)

I believe it backchains from the redistributes  to build a series of rules which can be applied, then runs those rules forwards to create the final output.

If you view the final redistributables as a set of predicates whose existence is taken as truth, absence as false, and all rules are implies operators the define a path to truth, not falsehood (i.e. we are reasoning over Horn Clauses, then yes, I think you could say "make is a backward chaining system to build a transformation resulting in "truth".

The problem is this: I'm not trying to build something for the sake of building it. I'm trying to build something to ship. I'm running builds and tests repeatedly, from my laptop on my desk, from my laptop in a conference auditorium, a hotel room, and a train doing 190 mph between Brussels and London. A that's all just this week.

Most of the time, those tests have been failing. There are three possible (and non-disjoint) causes of this
  • (a) the null hypothesis: I can't write code that works.
  • (b) a secondary hypothesis: I am better at writing tests to demonstrate the production code is broken than I am at fixing the production code itself.
  • (c) as the external environment changes, so does the outcome of the build process.

Let's pretend that (a) and (b) are false; that I can actually write code that works first time, with the tests intended to show that this condition is not met being well written and correct themselves. Even if such a case held, my build would have been broken for a significant fraction of the time it was this week.

Here's some real examples of fun problems, for "type 3 fun" on the Ordnance Survey Fun Scale.
  1. Build halting as the particular sequence of operations it had chosen depended on maven artifacts which were not only absent, but non-retrievable from a train somewhere under the English Channel.
  2. Connection Reset exceptions talking to an in-VM webapp from within a test case. A test case that worked last week. I never did find the cause of this. Though I eventually concluded that it last worked before I installed a critical OS.X patch (last weeks, not this week's pending one). The obvious action was "reboot the mac' —and lo, it did fix it. I just spent a lot of time on hypotheses (a) and (b) before settling on cause (c)
  3. Tests hanging in the keynote sessions because while my laptop had an internet connection, GET requests against java.sun.com were failing. It turns out that when Jersey starts some servlets up, it tries to do a GET for some XSD file in order to validate some web.xml XML document. If the system is offline, it skips that. But if DNS resolves java.sun.com, then it does a GET and blocks until the document is returned or the GET fails. As as the internet in keynote was a bit overloaded, tests just hung. Fix: edit /etc/hosts to put java.sun.com == 127.0.0.1 or turn off the wifi.
  4. A build at my hotel failing as the run crossed the midnight marker and maven decided to pull down some -SNAPSHOT binaries from mvn central, which were not the binaries I'd just built locally, during the ongoing build and test run.
What do all these have in common? Differences in the environment of the build, primarily networking, except case (4), which was due to the build taking place at a different time from previous builds.

Which brings me to a salient point
The environment of a build includes not only the source files and build rules, it includes the rest of the Internet and the connections to it. furthermore, as the rule engine uses not just the presence/absence of intermediate and final artifacts as triggers for actions, time is an implicit part of the reasoning.

You made could make explict that temporal logic, and have a build tool which look at the timestamp of newly created files in /tmp and flagged up when your filesystem was in a different timezone (Oh, look ant -diagnostics does that! I wonder who wrote that probe?) But it wouldn't be enough, because we've reached a point in which builds are dependent upon state external to even the local machine.

Our builds are therefore, irretrievably nondeterministic.

2013-10-16

Hadoop 2: shipping!

Deamz & Soker: Asterix

The week-long vote is in- Hadoop 2 is now officially released by Apache!

Anyone who wants to use this release should download Hadoop via the Apache Mirrors.

Maven and Ivy users: the version you want to refer to is 2.2.0

The artifacts haven't trickled through to the public repos as of 2013-10-16-11:18 GMT -they are on the ASF staging repo and I've been using them happily all week.

This release marks an epic of development, with YARN being a fundamental rethink of what you can run in a Hadoop cluster: anything you can get to run in a distributed cluster where failures will happen, the Hadoop FileSystem the API for filesystem access  -be it in Java or a native client- and data is measured by the Petabyte.

YARN is going to get a lot of press for the way it transforms what you can do in the cluster, but HDFS itself has changed a lot. This is the first ASF release with active/passive HA -which is why Zookeeper is now on the classpath. CDH 4.x shipped with an earlier version of this- and as we haven't heard of any dramatic data loss events, consider it well tested in the field. Admittedly, if you misconfigure things failover may not happen, but that's something you can qualify with a kill -9 of the active namenode service. Do remember to have to >1 zookeeper instance before you try this -testing ZK failure should also be a qualification process. I think 5 is a number considered safer than 3, though I've heard of one cluster running with 9. Nobody has admitted going up to 11.

This release also adds to HDFS
  1. NFS support: you can mount the FS as an NFS v3 filesystem. This doesn't give you the ability to write to anywhere other than the tail of a file -HFDS is still not-Posix. But then neither is NFS: its caching means that there is a few seconds worth of eventual consistency across nodes (\cite{Distributed Systems, Colouris, Dollimore & Kindberg, p331}).,
  2. Snapshots: you can snapshot some of a filesystem and roll back to it later. Judging by the JIRAs, quotas get quite complex there. What it does mean is that it is harder to lose data by accidental rm -rf operations.
  3. HDFS federation: datanodes can store data for different HDFS namenodes, -Block Storage is now a service- while clients can mount different HDFS filesystems to get access to the data. This is something of primarily of relevance to people working at Yahoo! and facebook scale -everyone else can just get more RAM for their NN and tune the GC options to not lock the server too much]
Hadoop 2 also adds is extensive testing all the way up the stack. In particular, there's a new HBase release coming out soon -hopefully HBase 0.96 will be out in days. Lots of other things have been tested against it -which has helped to identify any incompatibilities between the Hadoop 1.x MapReduce API (MRv1) and Hadoop 2's MRv2, while also getting patches into the the rest of the stack where appropriate. As new releases trickle out, everything will end up being built and qualified on Hadoop 2.

Which is why when you look at the features in Hadoop 2.x, as well as headline items "YARN, HDFS Snapshots, ...", you should also consider the testing and QA that went into this -this is the first stable Hadoop 2 release -the first one extensively tested all the way up the stack. Which is why everyone doing that QA -my colleagues, Matt Foley's QA team, the Bigtop developers, and anyone else working with Hadoop that built and tested their code against Hadoop 2.1 beta and later RCs -and reported bugs.

QA teams: your work is appreciated! Take the rest of the week off!

[photo: Deamz and Soker at St Philips, near Old Market]

2013-09-17

Hoya: coding and testing

Mission District Streets

I've been back in the UK this month, and am busy working on Hoya. The key activity right now is adding support for Apache Accumulo. This is because it forces me to make the changes sooner rather than later to go multi-application; to make Hoya more generic.

This means I've had to go from a simple model of (master, worker+) to a multi-role world one of (master, tablets+, [monitor], [gc]).

A two-role model is straightforward: the AM forks off the master, while all the other containers are automatically workers. Compare the no. of containers you have to the desired number, and request/release containers. When you get given containers, or one fails, you know its always a worker, so update the numbers. Flexing is achieved by having the client specify a new count of workers. Simple.

Multi-role means that not only do you have to have more complex data structures, you need to map containers and container requests to specific roles. That means when the RM notifies the AM of some new container assignments, the AM has to decide what they are for. The trick there -as suggested by one of my colleagues who I shall not name- is to use the priority:int field in the request, mapping that to role numbers. The AM then needs to spin up the relevant launcher for that role, and record details about the container so that on any failure notification it knows which role's node count to decrease. The AM then needs to scan all the role set to decide whether the current state is good, and how to react if not. There's also the detail of configuration; you have to move from simple options for, say, --workers 4 --workerheap 512M, to per role numbers and  options: --role worker 4  --roleopt worker jvm.heapsize 512M -role monitor 1 --roleopt monitor jvm.heapsize 1G

This gets turned into a set of role option maps, which have to be used to configure the specific roles.

I've also had to change how the client flexed the cluster size -from a simple int value to a whole new JSON cluster specification. Which leads to an interesting trick: you can not only tune the size of a cluster by role -you can change parameters like heapsize as you go.

Multi-role then: lots more complexity in managing things.

The other bit of complexity is of course deploying different application types. Here I've introduced the notion of a Provider; something that provides client-side setup services: build initial json spec, preflight checking of specifications, helping to set up the AM with extra resources, and patching configuration directories.

Server side, these providers now need to help manage the roles, with in-VM startup of the master process, and launcher thread startup of all the remote processes. This is still ongoing work. I did have accumulo execing, though its startup script needs to take the env variables of HADOOP_PREFIX and ZOOKEEPER_PREFIX as a preamble to its own classloading, which is something I may have to bypass before long on the basis it is trying to be too clever. But bring up the Accumulo master and the first thing it says is "init me". I may patch accumulo to add a special "--init" option here, but to keep the #of changes down, and support similar use cases, I've instead gone from a single executable to the ability to run a series of programs in the AMs container. And how have I ended up implementing that? With YARN services.

I've added a new YARN service, ForkedProcessService, which executes a native process when started, stopping itself when that process finishes -and converting a non-zero exit code into service failure with an ExitException with the relevant exit code. Any YARN service that can host children -of which the Hoya AM is one- can create one of these services, add it as a child, configure it and start it running. Registering as a service lifecycle listener lets this parent service get told when the child has finished, and can react to it failing and succeeding.

That works for HBase, with one process "bin/hbase master", but not for Accumulo's potential workflow of [accumulo init, accumulo master]. For that I've had to do another service, SequenceService, which runs its children in sequential order, only starting one when the previous one finishes successfully. Then I have my Provider Services extend that, to get the ability to exec a sequence of commands.

List<String> commands =
  buildProcessCommand(cd, confDir, env, masterCommand);

ForkedProcessService masterProcess = buildProcess(getName(), env, commands);
CompoundService compound = new CompoundService(getName());
compound.addService(masterProcess);
compound.addService(new EventNotifyingService(execInProgress,
                         cd.getOptionInt(
                           OPTION_CONTAINER_STARTUP_DELAY,
                           CONTAINER_STARTUP_DELAY)));
addService(compound);


The AM can now deploy a provider's in-AM role by telling the provider service to start() and let it sort the details out for itself. Which is pretty slick: it's services through Hoya, out-of-VM processes for the real work. To achieve this I've had to add two new container services, SequenceService: runs a list of services in order, failing when any of the child services file, stopping when they are all done. CompoundService runs a set of services in parallel, again propagating failures. Once all children have stopped, this parent service does too.

Comparing it to SmartFrog's workflow components, there are obvious similarities, though without the issues that component always had -because child services were potentially remote and only accessible via RMI, you couldn't interact with a stopped service, while the deployment model mostly mandated that everything was done declaratively at deploy time. In Hoya all the wiring up of services is done in-code; there's no attempt to be more declarative, and with every service running in-process, keeping an eye on them is much easier. That said, I'm having to do things like pass in callback interfaces -the execInProgress interface is implemented by the AM to let it know that the master process is going live. in SF I'd have stuck a reference to an exported RMI interface into the distributed component description graph, and let this workflow service pull it down. Still, here we avoid RMI -which is not a bad thing.

The other difference is that I am not trying to run any of these service components on any node in the cluster other than the single HoyaApplication Master. The goal is to only run on each allocated container the final program Hoya is managing, not any Hoya code at all. YARN does the work of getting the binaries over, starting the process and reporting failure. That assumption of a failure-aware execution layer atop a shared filesystem, with Zookeeper to provide consistent distributed state, means that I can delegate all those details to Hadoop.

Furthermore, I'm only trying to deploy applications that live in a Hadoop cluster -use HDFS for persistent state over a local filesystem, dynamically locate other parts of the application via ZK, and don't treat unannounced termination of a process or loss of a node as a disaster, more a mild inconvenience. This is precisely what today's classic Enterprise Java & Spring Server apps don't do: they use databases, message queues and often build-time URLs -if not build time, then certainly static for the lifespan of the program.

Handling those applications is a pain, because your deployment framework has to choreograph startup, wiring together distributed components of the system from dynamically built up hostnames and URLs of other component locations, try to execute the (expected) shutdown routines rather than just kill the processes, and, hardest of all, deal with the persistent data problem. Usually that's addressed by having a shared database, with the MQ to route stuff to services

Testing YARN applications


One thing I should discuss is the challenge of testing YARN applications, which I've now documented a bit on the wiki
  1. MiniYARNCluster is your friend
  2. MiniHDFS cluster loses logs when torn down, but is handy to keep you honest -make sure some tests use it for YARN deployment
  3. Linux VMs are more relalistic than an OS/X desktop, though there is the overhead of getting protoc updated. Once you've done it -snapshot it.
I now have a VM running in Rackspace Cloud that exists to do the Linux side D/L and test of Hoya and other Hadoop things -I just push stuff to github when I need to, and (currently manually) trigger a git pull and rebuild. The thought of automating all of that and going to jenkins has occurred to me -its the hassle of setting up the network proxies that puts me off -and the challenge of getting all that log data that doesn't get merged in with the the Log4J output.

I have thought of how to merge in the log output of the Hoya JVMs running in YARN containers. These JVMs generate data using the commons-logging API (Hadoop-internal) and SLF4J (Hoya), both of which are backed by Log4J. All I need to do is get that Log4J data merged with the output of the Junit JVM.

Merge post-test-run


Output all log4j records in the JSON format our little JSON log emitter then merge the VM results back in with the JUnit JVM. The clocks on all the logs will be consistent (it's the same host/VM), so they can be strictly ordered (I often end up using timestamps to compare what's going on in the RM & Test runner with the AM). The output would then need to be reworked so that the log entries are presented in a human readable format, instead of one JSON record per (long) line, with a process identifier included on each line.

Stream live to the test runner
Use a Log4J back end that forwards log events to a remote process, perhaps the test runner JVM itself. The collector would then output the Log events intermixed with the local events. Again, we need to differentiate the processes.

Back when I wrote the SmartFrog distributed xUnit test runner (JUnit3, SFUnit, ...), we did forward test results over the wire to a collector service, which could then aggregate test results from processes - similar to the work in [Duarte06]  . In this design we were running tests against multiple remote implementations, showing the results per test, rather than per implementation, so highlighting where things behaved differently. We also streamed out the results as XHTML, emitting the summary record at the end, rather than trying to buffer everything in the JVM until the end of the run. That in-JVM buffering is needed so as the classic Ant XML format sticks the summary in the attributes of the XML document. As a result, if the JVM dies: no output. If the test run generates too much log data: OOM and no output. Streaming XHTML means that you don't OOM from lots of log data, and if the process dies, your browser can still make a lot of the details. Oh, and with the right style sheet the results were directly viewable in the browser without the overhead of the XSL transform (though that always helps with summary data).

What, then, would I like? But which I don't have time to implement.
  1. Test runner to collect log events from multiple processes
  2. Test runner to stream these events out to a file, preserving log level and adding host information
  3. Test runner to print to stdout some feedback on what is going on so that someone sitting in front of a screen can see what is happening. This should be in a format for humans
  4. Something to take the streamed output and generate the traditional XML format for the benefit of Jenkins and other CI tools
  5. Something to take that streamed output and generate reports that can intermix the log events from different processes, and, by virtue of the retained log level data, let me show/hide different log levels, so that I can say "show the warnings", leaving info and debug hidden.
This would be quite an undertaking: I actually wonder if you could have some fun with the Kafka back end for Log4J and doing the analysis in Samza. That would be a bit of overhead on a single desktop though -but it could scale well to production tests. The alternative is have the Test Runner open some network port (RESTy/Post over Hadoop RPC), with log4J posting them in direct, runner to output to file as the JSON records; push them to screen using human-log4j, abusing the thread-ID field to identify remote processes. Then add some post-test run code for the generation of classic XML output, as well as something designed to display multi-process, multi-host test results better. Ideally, have Jenkins display that too.

Like I said: no time. But maybe next year I'll mentor a Google Summer of Code project to do this -it's a great cross-Apache bit of work, with Jenkins and possibly Junit & TestNG in the mix. Target Hadoop, Bigtop and other bits of the Hadoop stack. Yes, a nice project: volunteers with free time invited.

[Photo: somewhere in SF's Mission District: like Stokes Croft except with high-end furniture shops and the graffiti is mostly on the side streets, rather than integrated with the shops]

2013-03-10

Enterprise Hadoop: yes, but how are you going to fix it?

EMC's Pivotal HD has started a lot of debate as to whether building on top of Hadoop can be considered being part of a Hadoop ecosystem or whether it's an attempt to co-opt it: to do something and claim that it is part of a bigger system.

Can you say you are "part of the Hadoop stack" when all you are doing a closed source layer on top? I think that's quite nuanced, and depends on what you do -and how it's interpreted.


see no evil 2012


  1. The Apache License grants everyone the freedom to take the source away and do anything they want with it
  2. There is no requirement for you to contribute a single line of code back; a single bug report. 
This is a difference between the ASF license and GPL-licensed software which you redistribute: with GPL code the changes must (somehow) be published. 

Other aspects of the ASF license:
  1. You can't abuse ASF brand names, which in the Apache Hadoop world means you can't use Apache Hadoop, Apache HBase, Apache Mahout, Giraph, Apache Pig, Apache Hive, etc in your product names. There are some excellent guidelines on this in the wiki page Defining Hadoop -and if you want actual feedback, email the trademarks@ list. It may seem that doing so removes the secrecy/surprise factor of your product announcement, but it's better that than a hurried renaming of all your product and documentation.
  2. If you sue other users of the product over patents of yours that you believe apply to the technology -you revoke your own right to the software. I haven't known that to happen with Apache products -though the Oracle/Google lawsuit did cover copyright of APIs and reimplementations thereof. If APIs ever became copyrightable, then decades of progress in the computing industry will grind to halt.
People are also free to look at Apache APIs and clean-room re-implement them; you just can't use the Apache product names at that point. Asserting compatibility becomes indefensible: if you look at the ASF JIRAs, even 100% compatibility across versions is hard to achieve -that's with the same source tree. It's not the binary signature that is (usually) the problem, its what happens afterwards that's trouble. Little things like whether renaming a file is atomic, or what happens when you ask for the block locations of a directory.

Now, what about introducing a closed source product on top of Hadoop and saying you are part of the hadoop ecosystem, that you have x-hundred people working on Hadoop?

This is where it gets tricky.

Some people say "it's like building on Linux" -and there are some very big closed applications that run on Linux. A big one that springs to mind is Oracle RDBMs.

Are the thousands of people who work on Oracle-on-Linux "working on Linux"? Are they working on "Oracle on Linux", or are they working "on Oracle", on Linux?

Whatever way you look at it, those people aren't working in the Linux OS, just on something that runs on top of it . Would you call it part of the Linux "stack", the way MySQL and Apache HTTPD are?

Personally: I have no idea.

see no evil 2012


What probably doesn't happen from Oracle's work is any direct feedback from their application into the OS. [Correction: it does, thx @tlipcon]. I also doubt that RedHat, Novell and others regression test Oracle RDBMS on their latest builds of Linux. By their very nature, closed-source applications fall out of the normal OSS regression and release test processes, that rely not only on the open source trees, but the open test suites. This is also why Oracle's actions in not releasing all tests for MySQL seems so short sighted: it may hurt MariaDB, but it also hinders Linux regression testing.


Breaking that link between the OS and the application means that Oracle have not been in the position to rapidly adapt to problems in the OS and filesystem, because there's no way to push their issues back upstream, to get changes in, to get new releases out in a hurry to fix a problem with their application or hardware. Instead the onus becomes on the application to deal with the problem themselves.

How have Oracle handled this? Eventually, by getting into the Linux Distribution business itself, with Oracle Unbreakable Linux. By releasing a complete OS build, they can coordinate OS and application releases, they can fix their version of the OS to handle problems that surface in Oracle's applications -on a timetable that works for them. They also get to handle Oracle hardware support in a timely manner, and charge support revenue from users.
 
That works -at a cost. By forking RedHat Linux, Oracle have taken on all the maintenance and testing costs themselves.

The amount that Oracles charge has to cover those costs, or the quality of the Oracle fork of Linux degrades relative to the reference points of RHEL and Debian.

For Oracle, or the combined OS+11g+exadata deal has enough margins in the database that they can come up with a price is was less than ({HP | Dell}-RHEL-Oracle11g), and so presumably those costs can be covered. What's not clear is this: did Oracle get into the business of selling a supported Linux because they saw money in it, or because they concluded that their hardware and database products effectively mandated it?


Other companies getting into the business of redistributing Hadoop-derived products to customers who are paying those companies in the expectation of support are going to have start thinking about this.

If you have just sold something that has some Hadoop JARs in it -code that the customer depends on- and they have a problem, how are you going to fix it?

Here are some strategies:
  1. Hope it won't be a problem. Take the Apache artifacts, ship as is. It is, in the opinions of myself and my Hortonworks colleagues, production ready. Push customers with problems to issues.apache.org, forward them yourself. You could do the same with CDH, which in the opinions of my friends at Cloudera, also production ready.Do that, and issues on Apache JIRA will be ignored unless you can replicate them on the ASF artefacts.
  2. Build your own expertise: this takes time, and while that happens you aren't in a position to field support calls. If you make your own releases, you end up needing your own test infrastructure, QA'ing it, and tracking the changes in hadoop trunk and branch-1.
  3. Partner with the experts: work with people who have in-depth understanding of the code, it's history, why decisions were made and experience in cutting production scale releases suitable for use in web companies and enterprises. That means Hortonworks and Cloudera. Many of the enterprise vendors do this, because they've realised it was the best option.
The web companies, the early adopters went for #1 and ended up with #2: build your own expertise. This is effectively what I did in my HPLabs work on dynamic in-cloud Hadoop. You can see my journeys through the source -while working on big things, little things crop up, especially problems related to networking in a virtual world, configuration in a dynamically configured space, and recovery/sync problems that my service model discovered. I still know my way through a fraction of the code, but every project I work on builds up my understanding, and contributes stuff back to the core, including things like better specifications of the filesystem API's semantics, and the tests to go with it

That trail of JIRAs related to my work shows up something else: if you are delving deep into Hadoop, your reading of the code alone should be enough to get you filing bugs against minor issues, niggles, potential synchronization, cleanup or robustness problems. If you are pushing the envelope in what Hadoop can do: bigger issues.

We are starting to see some involvement in hadoop-core from Intel, though apart from the encryption contribs, it still appears to be at an initial state -though Andrew Purtell has long been busy in HBase. We do see a lot activity from Junping Du of VMWare -not just the topology work, but other big virtualisation features, and the day-to-day niggles and test problems you get working with trunk. Conclusion: at least one person in VMWare is full time on Hadoop. Which is great: the more bugs that get reported, the more patches, the better Hadoop becomes. Participating in the core code development project develops your expertise while ensuring that the Apache (hence Hortonworks and Cloudera) artifacts meet your needs.

Are there other contributors from EMC? Intel? I have no idea. You can't tell from gmail & ymail addresses alone; you'd have to deanonymize them by going via LinkedIn. That's not just name match; you can use the LI "find your contacts" scanner to go through those people's email addresses and reverse lookup their names. Same for twitter. I may just do that for a nice little article on "practical deanonymization".

In the meantime, whenever someone comes to you with a product containing the Apache Hadoop stack, say "if there is a problem in the Hadoop JARs - how are you going to fix it?"


[Artwork: See no evil by Inkie, co-organiser of the See No Evil event. Clearly painted with the aid of a cherry picker]