Milind has flagged up some nearby students at Bristol Uni attempting to r
eimplement the Transputer. I should look at that some time. For now, some little paper I was reading last week while frittering away an unexpected few days in a local hospital.
The Manchester Dataflow Machine
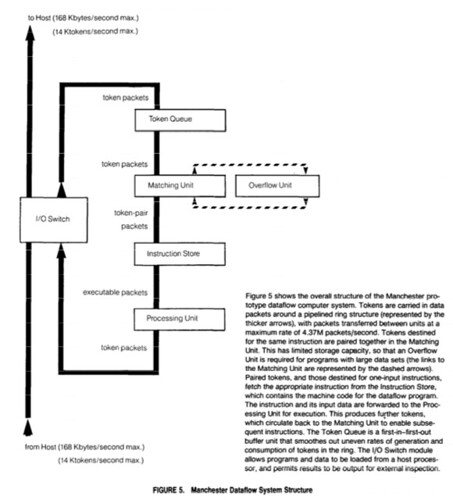
The MDM was some mid-1980s exploration of a post-microprocessor architecture, the same era as RISC, the Transputer and others. It was built from 74F-series logic, TTL rather than CMOS; performance numbers aren't particularly compelling by today's standard. What matters more is its architectural model.
In a classic von-Neumann CPU design, there's a shared memory for data and code; the program counter tells the CPU where to fetch the next instruction from. It's read, translated into an operation and then executed. Ops can work with memory, registers exist as an intermediate stage, essentially an explicit optimisation to deal with memory latency, branching implemented by changing the PC. The order of execution of operations is defined by the order of machine code instructions (for anyone about to disagree with me there: wait; we are talking pure von-Neumann here). It's a nice simple conceptual model, but has some flaws. A key one is that some operations take a long time (memory reads if there a cache misses, some arithmetic operations (example: division). The CPU waits, "stalls" until the operation completes, even if there is a pipeline capable of executing different stages of more than one operation at a time.
What the MDM did was accept the inevitability of those delays -and then try to eliminate them by saying "there is no program counter, there are only data dependencies".
Instead of an explicitly ordered sequence of instructions, your code lists operations a unset or binary operations against the output of previous actions and/or fetches from memory. The CPU then executes those operations in a order which guarantees those dependencies are met, but where the exact order is chosen based on the explicit dependency graph, not the implicit one of the sequence of opcodes produced by the compiler/developer.
Implementation-wise, they had a pool of functional units, capable of doing different operations, wired up by something which would get the set of instructions from (somewhere), stick them in the set of potential operations, and as slots freed up in the functional units, dispatch operations which were ready. Those operations generated results, which would make downstream operations ready for dispatch.

This design offered parallel execution proportional to the number of functional units: add more adders, shifters, dividers and they could be kept busy. Memory IO? Again, a functional unit could handle a read or a write, though supporting multiple units may be trickier. Otherwise, the big limitation on performance comes in conditional branching: you can't schedule any work until you know it's conditions are met. Condition evaluation, then, becomes a function of its own, with all code that comes after dependent on the specific outcomes of the condition.
To make this all usable, a dataflow language was needed; the one the paper talks about is
SISAL. This looks like a functional language, one designed to compile down to the opcodes a dataflow machine needs.
Did it work? yes. Did it get adopted? No. Classic procedural CPUs with classic procedural HLLs compiling down to assembly language where the PC formed an implicit state variable is what won out. It's how we code and what we code for.
And yet, what are we coding: dataflow frameworks and applications at the scale of the datacentre. What are MapReduce jobs but a two step dataflow? What is Pig but a dataflow language? Or Cascading? What are the query plans generated by SQL engines but different data flow graphs?
And if you look at Dryad and Tez, you've got a cluster-wide dataflow engine.
At the Petascale, then, we are working in the Dataflow Space.
What we aren't doing is working in that model in the implementation languages. Here we write procedural code that is either converted to JVM bytecodes (for an abstract register machine), or compiled straight down to assembly language? And those JVM bytecodes: down to machine code at runtime. What those compilers can do is reorder the generated opcodes based on the dataflow dependency graph which it has inferred from the source. That is, even though we went and wrote procedurally, the compilers reversed the data dependencies, and generated a sequence of operations which it felt were more optimal, based on its knowledge of and assumptions about the target CPU and the cache/memory architecture within which it resides.
And this is the fun bit, which explains why the MDM paper deserves reading: the Intel P6 CPU of the late 1990s —as are all its successors- right at the heart, built around a dataflow model. They take those x86 opcodes in the order lovingly crafted by the compiler or hard-core x86 assembler coder and go "you meant well, but due to things like memory read delays, let us choose a more optimal ordering for your routines". Admittedly, they don't use the MDM architecture, instead they use
Tomasulo's algorithm from the IBM 360 mainframes
A key feature there is "reservation stations", essentially register aliasing, addressing the issue that Intel parts have a limited and inconsistent set of registers. If one series of operations work on registers
eax and
ebx and a follow-on sequence overwrites those registers, the second set gets a virtual set of registers to play with. Hence, it doesn't matter if operations reuse a register, the execution order is really that of the data availability. The other big trick: speculative execution.
The P6 and successor parts will perform operations past a branch, provided the results of the operations can fit into (aliased) registers, and not anything with externally visible effects (writes, port IO, ...). The CPU tags these operations as speculative, and only realises them when the outcome of the branch is known. This means you could have a number of speculated operations, such as a read and a shift on that data, with the final output being visible once the branch is known to be taken. Predict the branch correctly and all pending operations can be realised,; any effects made visible. To maintain the illusion of sequential non-speculative operation, all operations with destinations that can't be aliased away have to be blocked until the branch result is known. For some extra fun, any failures of those speculated operations can only be raised when the branch outcome is known. Furthermore, it has to be the first failing instruction in the linear, PC-defined sequence that must visibly fail first, even if an operation actually executed ahead of it had failed. That's a bit of complexity that gets glossed over when the phrase "out of order execution" is mentioned. More accurate would be "speculative data-flow driven execution with register aliasing and delayed fault realisation".
Now, for all that to work properly, that data flow has to be valid: dependencies have to be explicit. Which isn't at all obvious once you have more than one thread manipulating shared data, more than one CPU executing operations in orders driven by its local view of the data dependencies.
Initial state
int p=0;
int ready = 0;
int outcome=100;
int val = 0;
Thread 1
p = &outcome;
ready = 1;
Thread 2
if (ready) val = *p;
Neither thread knows of the implicit dependency of
p only being guaranteed to be valid after '
ready' is set. if the deference
val = *p is speculatively executed before the condition
if (ready)is evaluated, then instead of
ready==true implying
val == 100, you could now have a stack traces from attempting to read the value at address 0. This will of course be an
obscure and intermittent bug which will only surface in the field in many-core systems, and never under the debugger.
The key point is: e
ven if the compiler or assembly code orders things to meet your expectations, the CPU can make its own decisions.
The only way to make your expectations clear is by getting the generated machine code to contain flags to indicate the happens-before requirements, which, when you think about it, is simply adding another explicit dependency in the data flow, a must-happen-before operator in the directed graph. There isn't an explicit opcode for that, barrier opcode goes in which tell the CPU to ensure that all operations listed in the machine code before that op will complete before the barrier. Equally importantly, that nothing will be reordered or speculatively executed ahead of it: all successor operations will then happen after. That is, the op code becomes a dependency on all predecessor operations, all that come after have the must-come-after dependency on this barrier. In x86, any operation with the LOCK attribute is a barrier, as are others (like
RDTSCP). And in Java, the volatile keyword is mapped to a locked read or write, so is implicitly a barrier. No operations will be promoted ahead of the a volatile R/W, either by Javac, or by the CPU, nor will any be delayed. This means volatile operations can be very expensive, as if you have a series of them, even if there is no explicit data-dependency, they will be executed in-order. It also means that at compile-time, javac will not move operations on volatile fields out of a loop, even if there's no apparent update to them.
Given these details on CPU internals, it should be clear that we now have dataflow at the peta-scale, and at the micro-scale, where what appear to be sequential operations have their data dependencies used to reorder things for faster execution. It's only the bits in the middle that are procedural. Which is kind of ironic really: why can't it be dataflow all the way down? Well the MDM offered that, but nobody took up the offering.
Does it matter? Maybe not. Except that if you look at Intel's recent CPU work, it's adding new modules on the die for specific operations. First CRC, then AES encryption -and the new erasure coding in HDFS work is using some other native operations. By their very nature, these modules are intended to implement in Si algorithms which take many cycles to process per memory access. Which means they are inherently significantly slower than existing functional units in the CPU. Unless the hardware implementations are as fast as operations like floating point division, code that depends on the new operations' results are going to be held up for a while. Because all that OOO dataflow work is hidden, there's no way in the x86 code to send that work off asynchronously.
It'd be interesting to consider whether it would be better to actually have some dataflow view of those slow operations, something like Java's futures, where slow operations are fired off asynchronously, with a follow-up operation to block until the result of the operation is ready -with any failures being raised as this point. Do that and you start to give the coders and compiler writers visibility into where big delays can surface, and the ability to deal with them, or at least optimise around them.
Of course, you do need to make that stuff visible in the language too
Presumably someone has done work like that; I'm just not current enough with my reading.
Further Reading
[1] How Java is
having its memory model tightened
[2] How C++ is giving you more
options to do advanced memory get/set

